Forensic Anthropology Vol. 2, No. 2: 129–138
DOI: 10.5744/fa.2019.1002
TECHNICAL NOTE
Estimating the Number of Individuals in a Large Commingled Assemblage
Andrea Palmiottoa,b* ● Carrie Ann Brownc ● Carrie B. LeGardec,d
ABSTRACT: Estimation of the number of individuals in an assemblage is critical to determine the scale of an incident and whether all expected individuals have been accounted for. However, estimates are affected by recovery and other taphonomic factors inherent to the assemblage, as well as the estimation methods themselves. This study examines several quantification methods using data from the commingled remains of individuals who were aboard the USS Oklahoma at the time of its sinking. Alternatives to traditional minimum number of individuals (MNI) quantifications are presented, to include MNI by duplicated elements per mitochondrial DNA (mtDNA) sequence and use of the zonal inventory procedure. These methods are assessed to determine which provides an estimate closest to the expected population size. Potential advantages and limitations associated with each method are discussed. For this assemblage, a combination of mtDNA sequencing using hypervariable regions 1 and 2 (HV1, HV2) and element duplication provides the most accurate estimate of individuals, and methods that employ pair-matching perform better than those that do not.
KEYWORDS: forensic anthropology, commingled skeletal remains, MNI, zonation method
Individual identification is a primary goal for forensic anthropologists who work in medicolegal and humanitarian contexts. However, when skeletal remains are commingled, analyses and individual identification can become more complicated and even impossible until commingling is at least partially resolved. A collection of bones, or assemblage, with duplicated elements or overlapping portions indicates that commingling is present; however, it should be noted that the lack of duplicated elements does not always indicate that only one individual is present. Recovery context and methods, scale of the incident, and the degree of commingling affect which methods may be appropriate to identify and resolve commingling within an assemblage (Byrd & Adams 2014; Ubelaker 2002).
One of the first steps in analyzing commingled assemblages is to determine the number of individuals represented, which can be done using a variety of methods. This step is critical for determining the scale of an incident and assessing whether all individuals have been recovered, as well as for planning purposes, to include resource allocation, analytical approaches, and the direction of future recovery efforts.
Assemblages vary based on recovery context and taphonomic conditions affecting the associated elements, and the various individuating methods can provide different estimates. Few methods have been adequately compared or tested on assemblages of known size (Lambacher et al. 2016; Lyman 2018; Mack et al. 2016; Marean & Spencer 1991; Nikita & Lahr 2011; Robb 2016; Sussman 2017), and estimates can be hindered by inconsistent inventory terminology. Although the exact number of individuals represented in this assemblage is not known, there is an expected number of individuals based on historical information, which can be compared with the various estimates presented in this article. This article presents the results of several MNI methods, highlights a standardized way to inventory skeletal elements, and assesses the most likely number of individuals (MLNI) from a large commingled sample.
Individuating Methods
MNI and MLNI are methods used to quantify the number of individuals represented in an assemblage. The MNI methods were developed to ensure that each individual is only counted once in an assemblage with the intent of avoiding overestimations. Minimum number quantifications have roots in zooarchaeological analyses, which typically include commingled assemblages from multiple species (Reitz & Wing 2008).
MNI determines the smallest number of individuals needed to account for the physical remains that are recovered in an assemblage (Lyman 1994; Reitz & Wing 2008). This is typically done by determining the minimum number of elements (MNE) for each element, which is generally defined in this application as a single complete bone or tooth (e.g., sacrum, left humerus, etc.), but may include skeletal portions (e.g., proximal left humerus), and therefore must be defined at the beginning of analysis. The most abundant element per taxon represents the MNI estimate for that species. Variations in MNE within an assemblage provide the additional benefit of depicting differential recovery and under-represented elements. A more robust MNI estimate can be calculated when age or other unique indicators are considered. Overall, however, calculations of MNE and MNI are relatively easy, provided accurate and consistent documentation of the skeletal elements.
In cases of fragmented remains, MNI is traditionally estimated based on the reported completeness of the most common element (Ubelaker 1974; White 1953). Present portions of bone (e.g., proximal or distal) are used as the basis of quantification with the goal to identify anatomically overlapping portions. In this study, “traditional” MNI and MNE are calculated based on simple designations of present portions. However, this method is most effective when assemblages are small, remains are not highly fragmented, and/or only a single analyst consistently assesses the remains. When multiple analysts are involved in the inventory process, or when assemblages are large and/or highly fragmented, differences in interpretations of remains and inventory processes can skew MNI estimates.
The number of individual specimens per taxon (NISP) is another quantitative measure that in essence is simply a raw count of all of the elements and fragments within an assemblage. This measure should not be used to account for the number of associated individuals, because it may lead to considerable overestimation, particularly when fragmentation is high (Dominguez-Rodrigo 2012; Gifford-Gonzalez 2018; Grayson 1984; Kline & Crub-Urize 1984; Lyman 2018; Marshall & Pilgram 1993).
In zooarchaeological cases, the entirety of fauna at a site is rarely, if ever, recovered. Additionally, taxa representation must be accounted for within an assemblage, especially for cases where fauna contain different numbers of bones per skeleton (e.g., fish versus mammal skeletons). In order to explore activity and site use patterns within and across sites, MNI is, therefore, a valuable tool. However, MNI tends to represent ordinal-scale relationships between species, and it is not intended to provide absolute counts of individuals (Lyman 2018; Reitz & Wing 2008). When applied to forensic anthropology, the context for MNI assessments differs. Only one species is emphasized in forensic anthropology cases, and forensic anthropologists often aim to recover the entirety of a given skeletal assemblage, not subsets of a larger population. For forensic anthropologists, absolute counts are necessary to determine if all expected individuals have been recovered or if additional recovery operations are required.
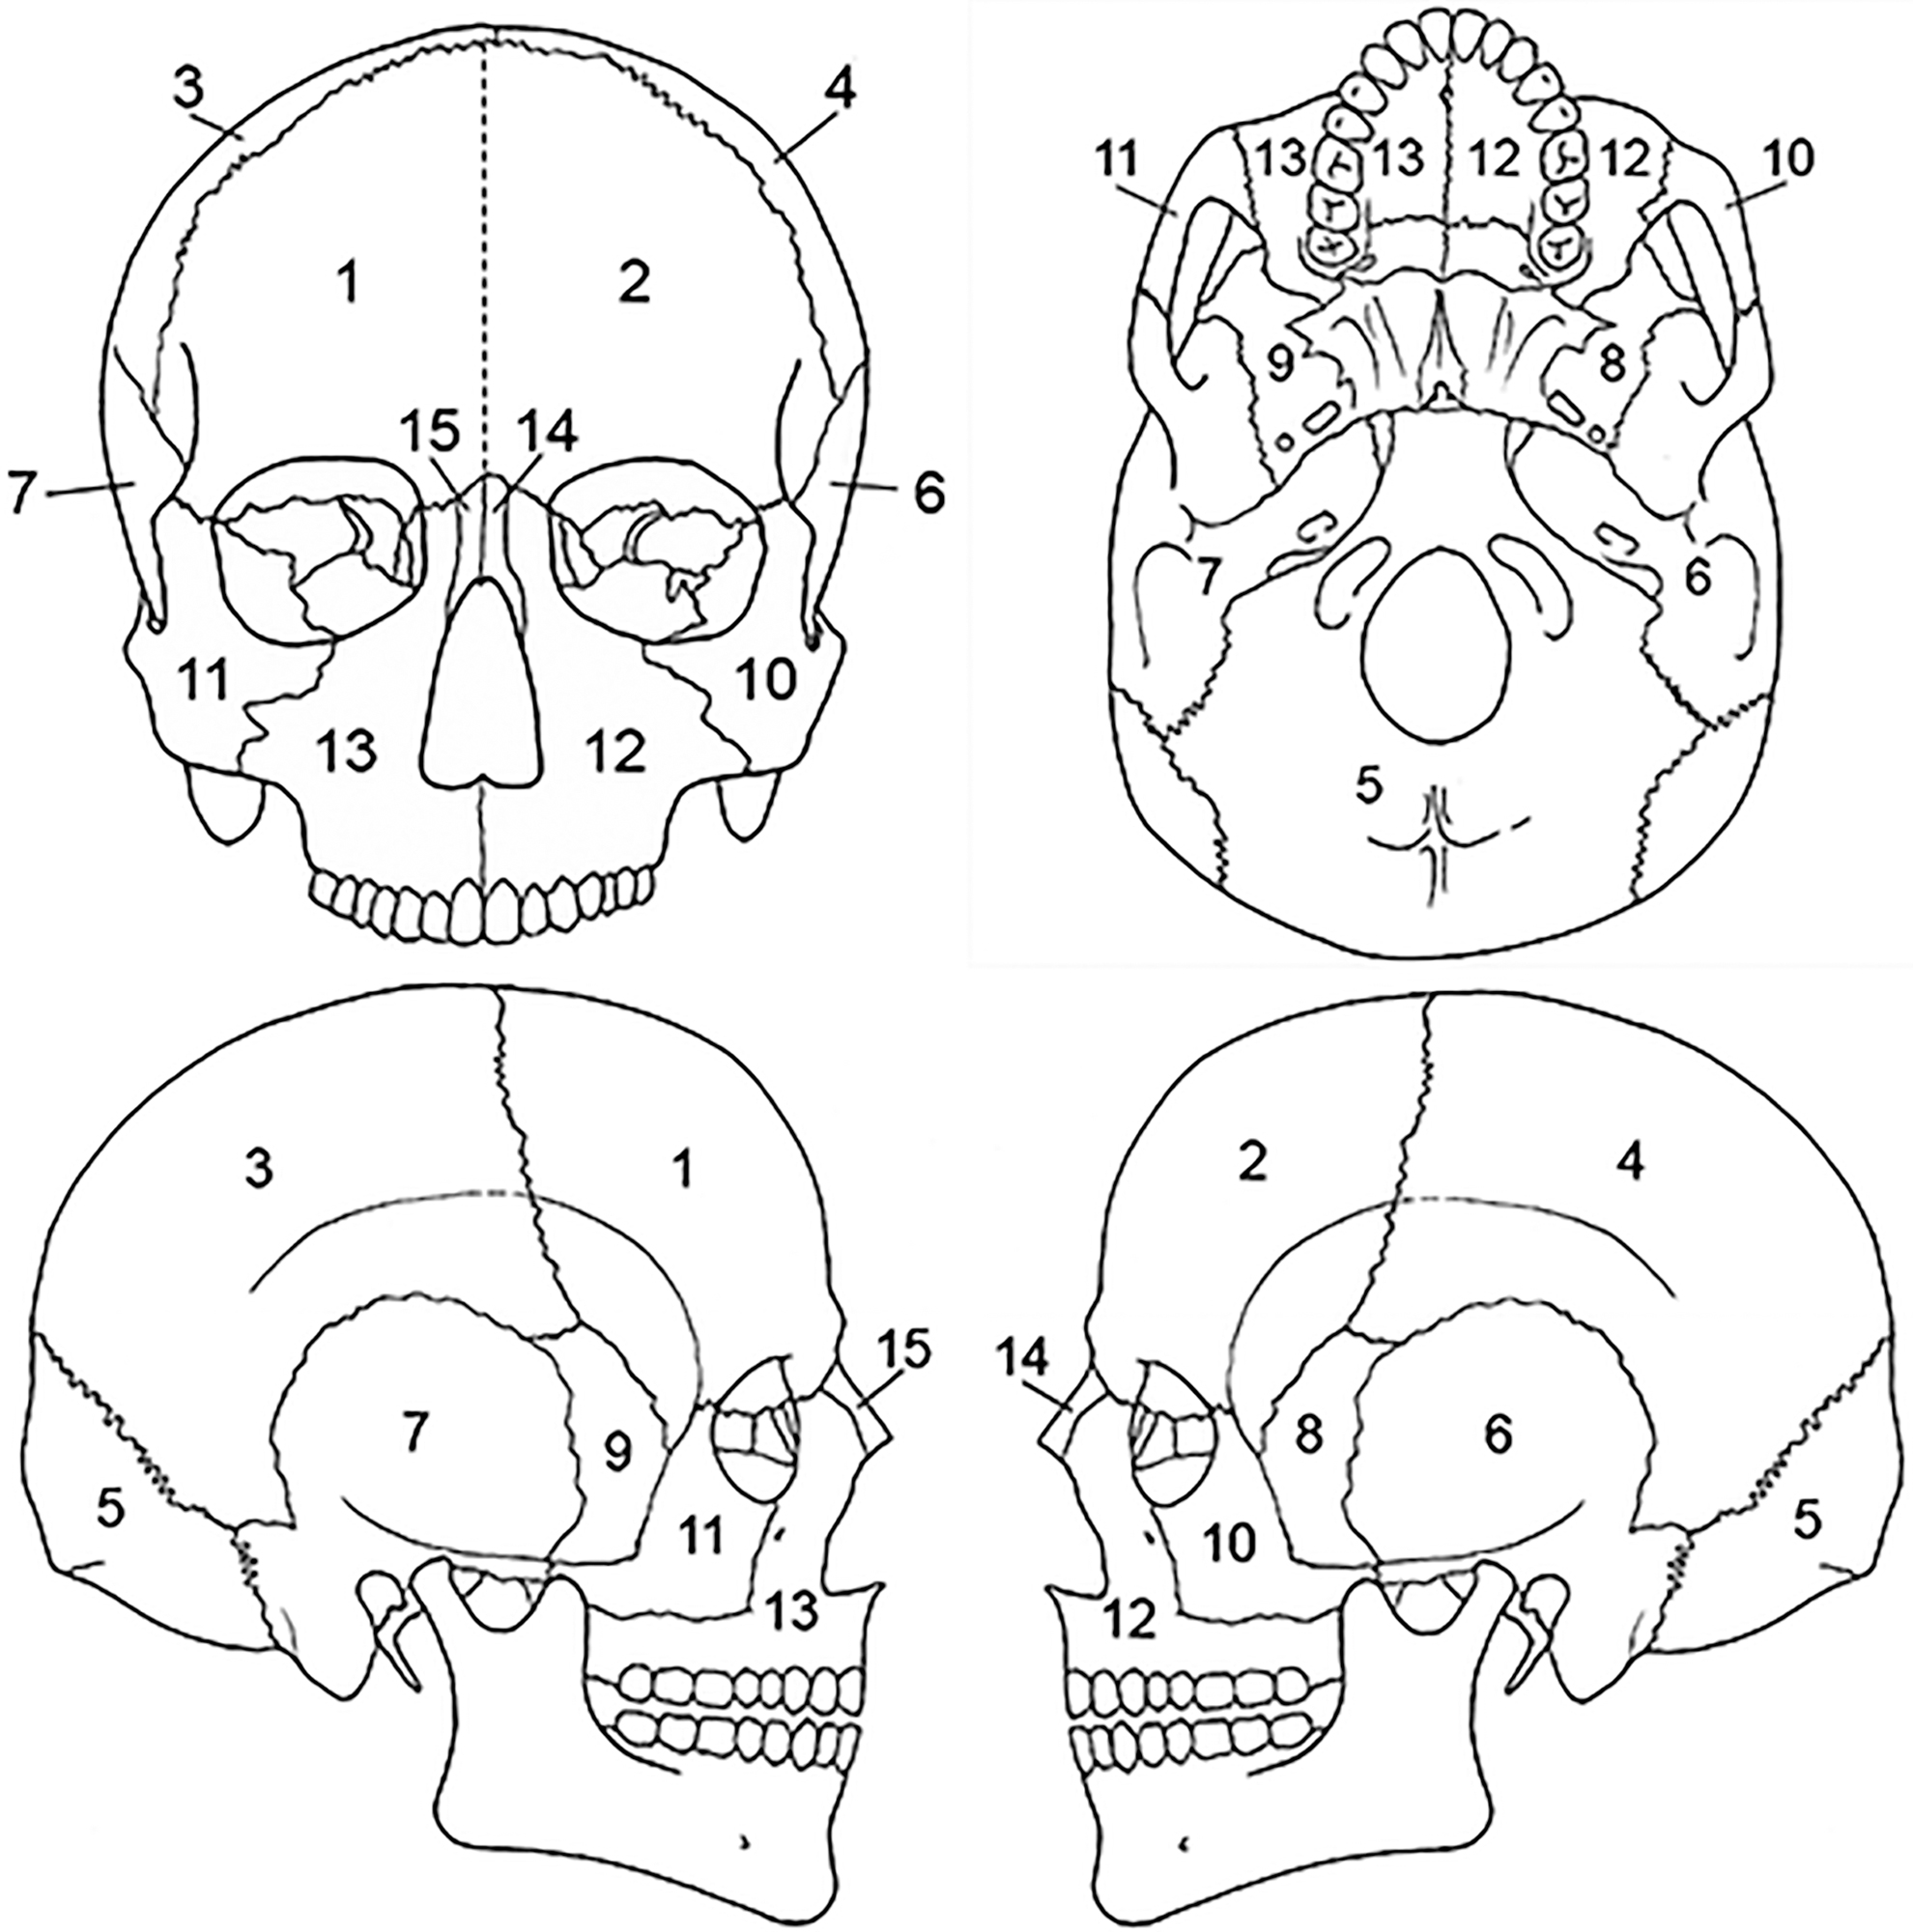
To address one of the issues in MNI calculation—the subjectivity of completeness descriptors in initial inventory procedures—Knüsel and Outram (2004) developed a standardized and replicable method to estimate MNI from human remains in bioarchaeological assemblages. Each skeletal element is divided into zones based on expected postmortem breakage patterns as observed in non-human archaeological exemplars. The number of zones per element ranges from 1 (e.g., carpals) to 15 (e.g., cranium) and is often characterized by diagnostic traits that allow for the identification of isolated fragments. Additionally, at least one zone must be described per identified fragment. Knüsel and Outram (2004) indicate that zones are counted even if the zone is only partially represented; they do not give any indication how much of a zone should be observable in order to be marked as present.
Methods that recognize paired elements in an assemblage include grand minimum total (GMT; Horton 1984) and most likely number of individuals (MLNI; Adams & Konigsberg 2004). The former produces an MNI estimate based on counts of paired and unpaired elements, and the latter calculates the maximum likelihood estimate of the total number of individuals that may have originally comprised an assemblage. Additionally, the highest density region (HDR; Adams & Konigsberg 2004) can be calculated to determine an associated confidence interval for MLNI. Pair-matching ideally is conducted on the most frequently recovered antimeres. An element must be compared to all contralateral elements and accurately matched. Uncertainties in pair-matching will have a negative impact on the accuracy of GMT and MLNI. Therefore, accurate inventories and pair-matching are critical to estimate the number of individuals represented.
MLNI recognizes an inherent bias in MNI: because MNI is calculated using only one element per taxon, any individuals that are not represented by that element will not be accounted for. MLNI is based on capture-recapture studies of living animals and has been modified for osseous collections. MLNI considers the unlikelihood of recovering 100% of an assemblage and attempts to account for individuals that may not be present in the pair-matched elements. Previous assessments of MLNI typically have focused on smaller assemblages (<50 individuals) where the size of the original loss population was unknown (Konigsberg & Adams 2014). MLNI has rarely been tested on larger assemblages of known size; Konigsberg and Adams (2014) assessed variable recovery rates and compared MLNI and MNI estimates on simulated populations containing up to 150 individuals. They discussed the high accuracy of MLNI versus MNI (GMT) estimates when recovery rates reached or exceeded 50%. Konigsberg and Adams (2014) suggest that the remains must be well preserved and at least 50% of an assemblage must be recovered to adequately assess MLNI.
The application of any of these methods is dependent on the condition of the assemblage. Taphonomic factors can affect the integrity of bone, such as the amount of fragmentation and degree of preservation. Additional concerns include resource availability, allotted analytical time, and expertise of the analysts. Not every method can be applied for every situation; therefore, the selection of methods should be carefully considered.
Materials and Methods
The assemblage used for this study consists of the commingled skeletal remains recovered from the USS Oklahoma. Following identification efforts in the 1940s, the number of unidentified Oklahoma casualties was established as 394. For information on this assemblage see Brown (2019).
All elements in the assemblage were inventoried, measured, and labeled prior to other analyses, and all data were compiled in Microsoft Excel spreadsheets. The elements are largely intact with limited fragmentation. Observed taphonomic alterations include adherent oil residue, rust staining, and cortical erosion. Inventory of the assemblage includes a traditional description of the completeness and condition of the remains. Traditional descriptors were reported; elements were characterized as “partial,” “mostly complete,” or “complete,” while the present portions (e.g., proximal, distal, and shaft) were additionally reported for long bones. At the same time, the presence of zones was recorded. For this research a zone was counted as present if at least 50% of the zone was present.
Traditional MNI and MNE estimates are based on the traditional descriptors and present portions. In contrast to traditional MNI and MNE estimates, we calculate zonation MNI and MNE wherein the most common zone is identified per element. The zonation method limits the bias of interobserver variation (e.g., what constitutes proximal one-third or distal one-fourth) that may exist. Because of the low degree of fragmentation in this assemblage, however, we expect that these traditional and zonal MNE numbers will be similar.
Where applicable and during the initial inventory, elements were assessed for pair matches and articulations within each “bundle”1 providing the basis of an anthropologically informed DNA sampling strategy (e.g., if an analyst assessed contralateral elements as pair matches, only the left side was sampled for DNA testing; see Brown 2019). Exceptions to this practice include the sampling of all complete cranial remains and all left and right humeri and tibiae to aid calculations of MNI. Nearly 5,000 elements were sampled for DNA analysis. Sequencing of the DNA focuses primarily on HV1 and HV2.
The initial inventory recorded nearly 13,000 elements. Based on the percentages derived from computed tomography volume rendering (Rowbotham et al. 2017), approximately 55% of the expected remains are represented. Traditional and zonal MNE were calculated for the assemblage based on the cranium, humerus, and femur. These elements are included in this study because all mtDNA analyses have been completed for cranial and dental remains, both left and right humeri were sampled for DNA analyses, and the femur is commonly considered one of the most durable bones in the human body.
GMT and MLNI were calculated for the humerus because this element was subjected to large-scale pair-matching. The equations used to calculate GMT and MLNI are presented below, where L is the number of left humeri, R is the number of right humeri, and P is the count of the number of pairs (Adams & Konigsberg 2004):
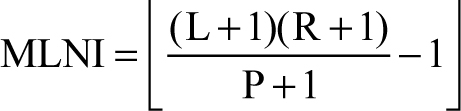
The pair-matching numbers used in this study are from a test conducted by a single, experienced analyst (LeGarde 2019). Since all humeri were sampled for DNA, the pair-matching results are verified based on mtDNA results to date. Finally, MNI was calculated based on the most numerous duplicated element per mtDNA sequence in order to assess how additional information, in this case mtDNA data, can aid in more accurate approximations of the population size (e.g., for an mtDNA sequence that has no associated skeletal duplication, MNI = 1; however, for a sequence that includes three right femora, MNI = 3).
In attempt to describe the amount of fragmentation present per element within the assemblage, the MNE is divided by the NISP (Table 1). The resulting value represents the estimated frequency of complete elements, or completion rate. The idea behind it is that an assemblage with no fragmentation will have a 100% completion rate (i.e., NISP = MNE), while a highly fragmented assemblage will have a lower completion rate. This frequency can be used to quickly assess the overall fragmentation of an assemblage once MNE has been calculated.
TABLE 1—Summary of USS Oklahoma osseous remains discussed in text.
|
Element |
NISP |
Percent of Complete Elementsa |
||
|
Cranium |
421 |
86.46 |
||
|
Left femur |
359 |
95.54 |
||
|
Right femur |
363 |
94.49 |
||
|
Left humerus |
306 |
95.42 |
||
|
Right humerus |
304 |
96.05 |
aPercent of complete elements calculated using NISP divided by zonal MNE (see Table 2).
Additionally, an accepted MNI is established based on duplicated elements per mtDNA sequence obtained. Although there is an expected number of individuals based on historical context (394), theoretically, the results from the duplicated elements per mtDNA sequence provide the most accurate representation of the number of individuals because (1) the expected number is based on the available historical information, which may be incomplete; (2) extensive mtDNA sampling was conducted for the project; and (3) more than a single element type is considered by the results based on duplicated elements per mtDNA sequence. Therefore, the MNI based on duplicated elements per mtDNA sequence is considered the accepted MNI and is used to assess the assemblage in terms of the historical MNI and the other MNI methods.
Although the accepted MNI is a robust calculation that should account for the majority of individuals, it should not be assumed as the actual number of individuals, because (1) not all elements were recovered for this assemblage; (2) not all individuals may be represented by the samples taken for DNA analysis; and (3) even if no duplicated elements are present in a sequence, the available elements could still represent more than one individual, and this study does not attempt to determine MNI based on other methods (e.g., osteometric sorting, pair-matching [of elements aside from the humerus], or articulation).
Results
A total of 421 crania, 722 femora, and 610 humeri are included in the Oklahoma inventory (see Table 1). These numbers reflect the NISP for each element and include fragments, which may represent overlapping portions, so these raw counts cannot be used to determine the number of individuals. Additionally, the long bone NISP does not include elements that could not be sided during the inventory process. From the humeri, 287 left and 293 right humeri were used for the pair-matching study (representing an approximate 73% humeri recovery rate); the remaining humeral fragments were too incomplete for pair-matching.
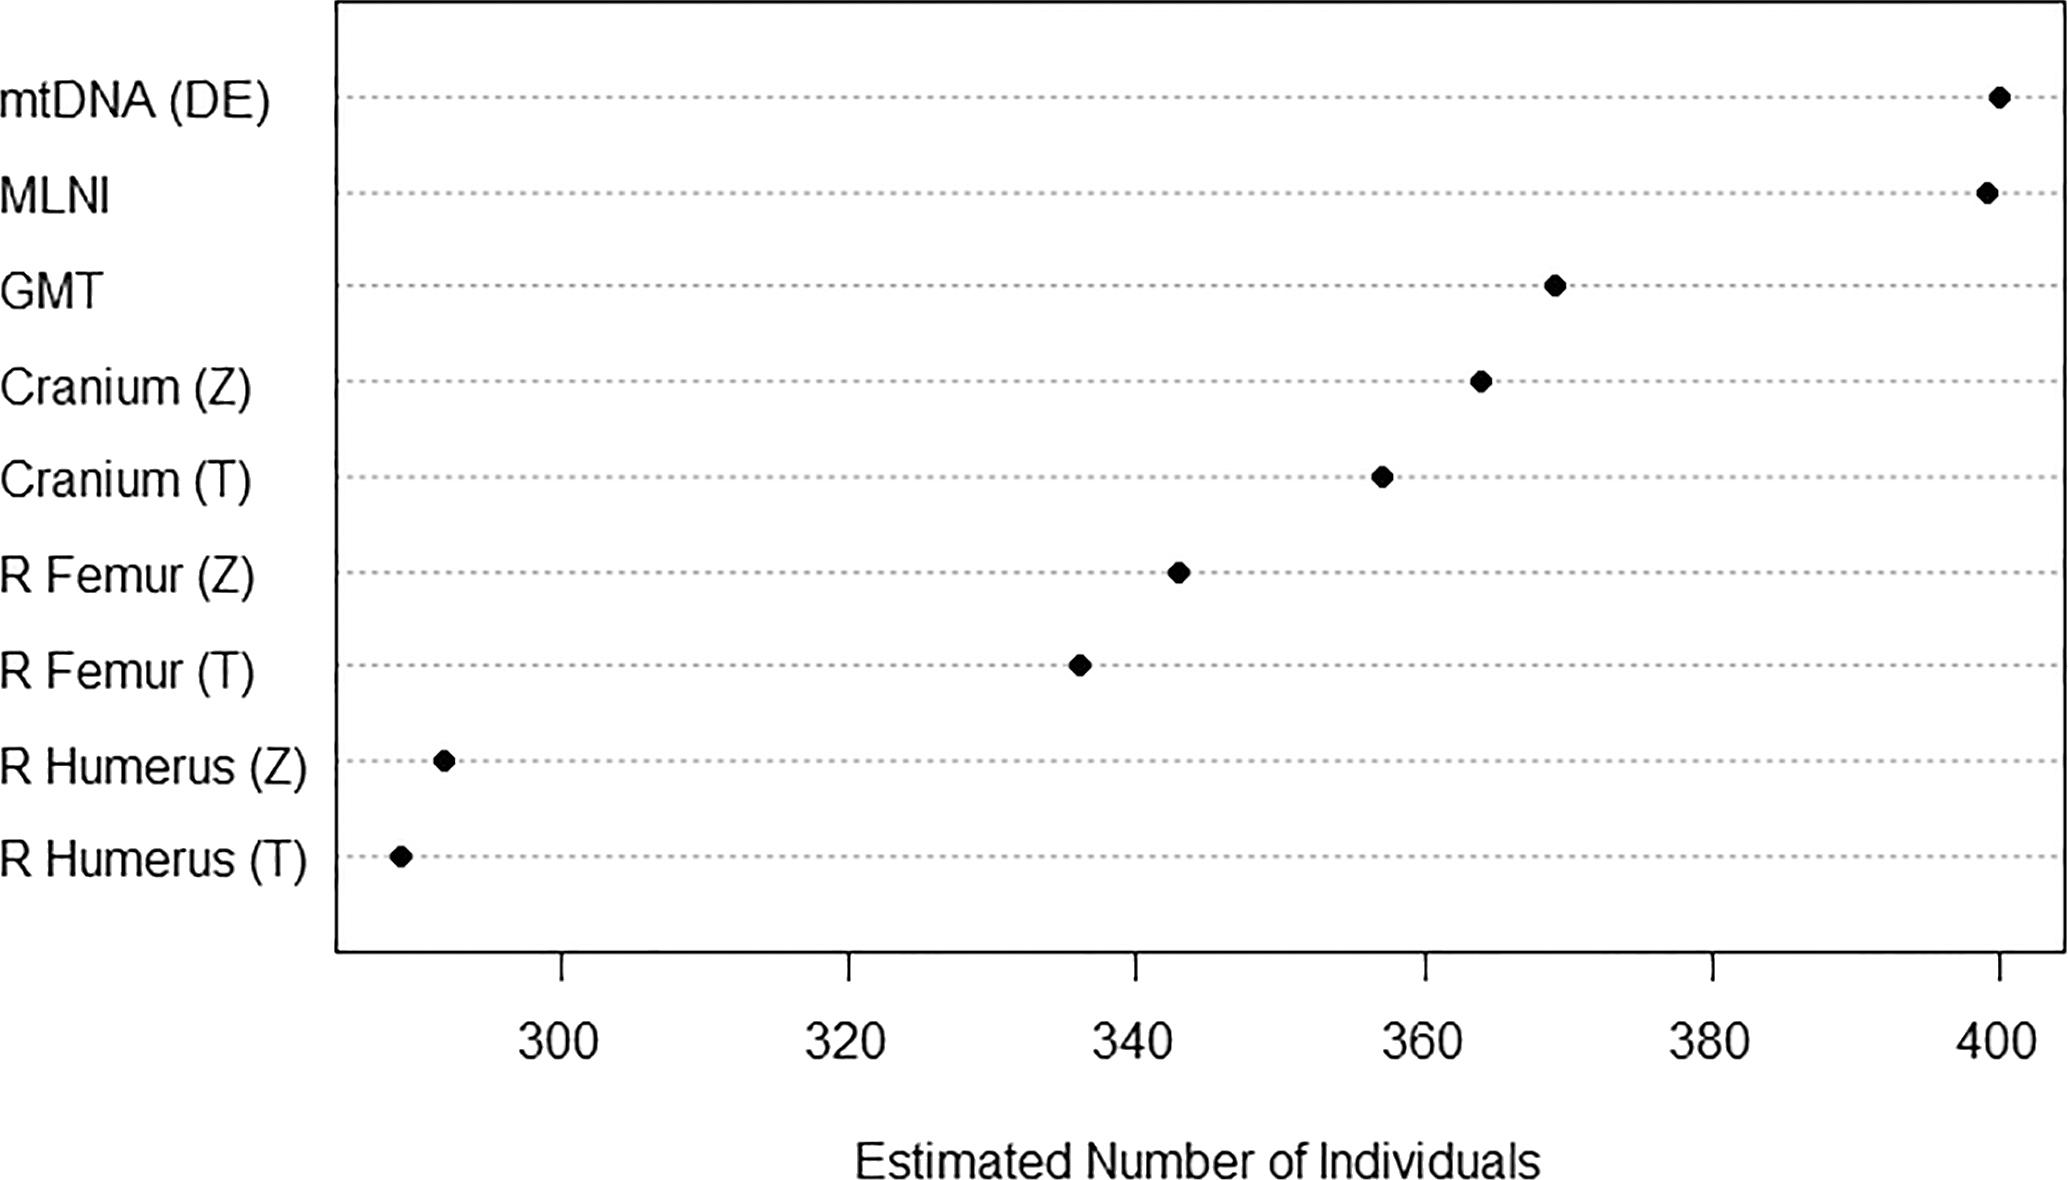
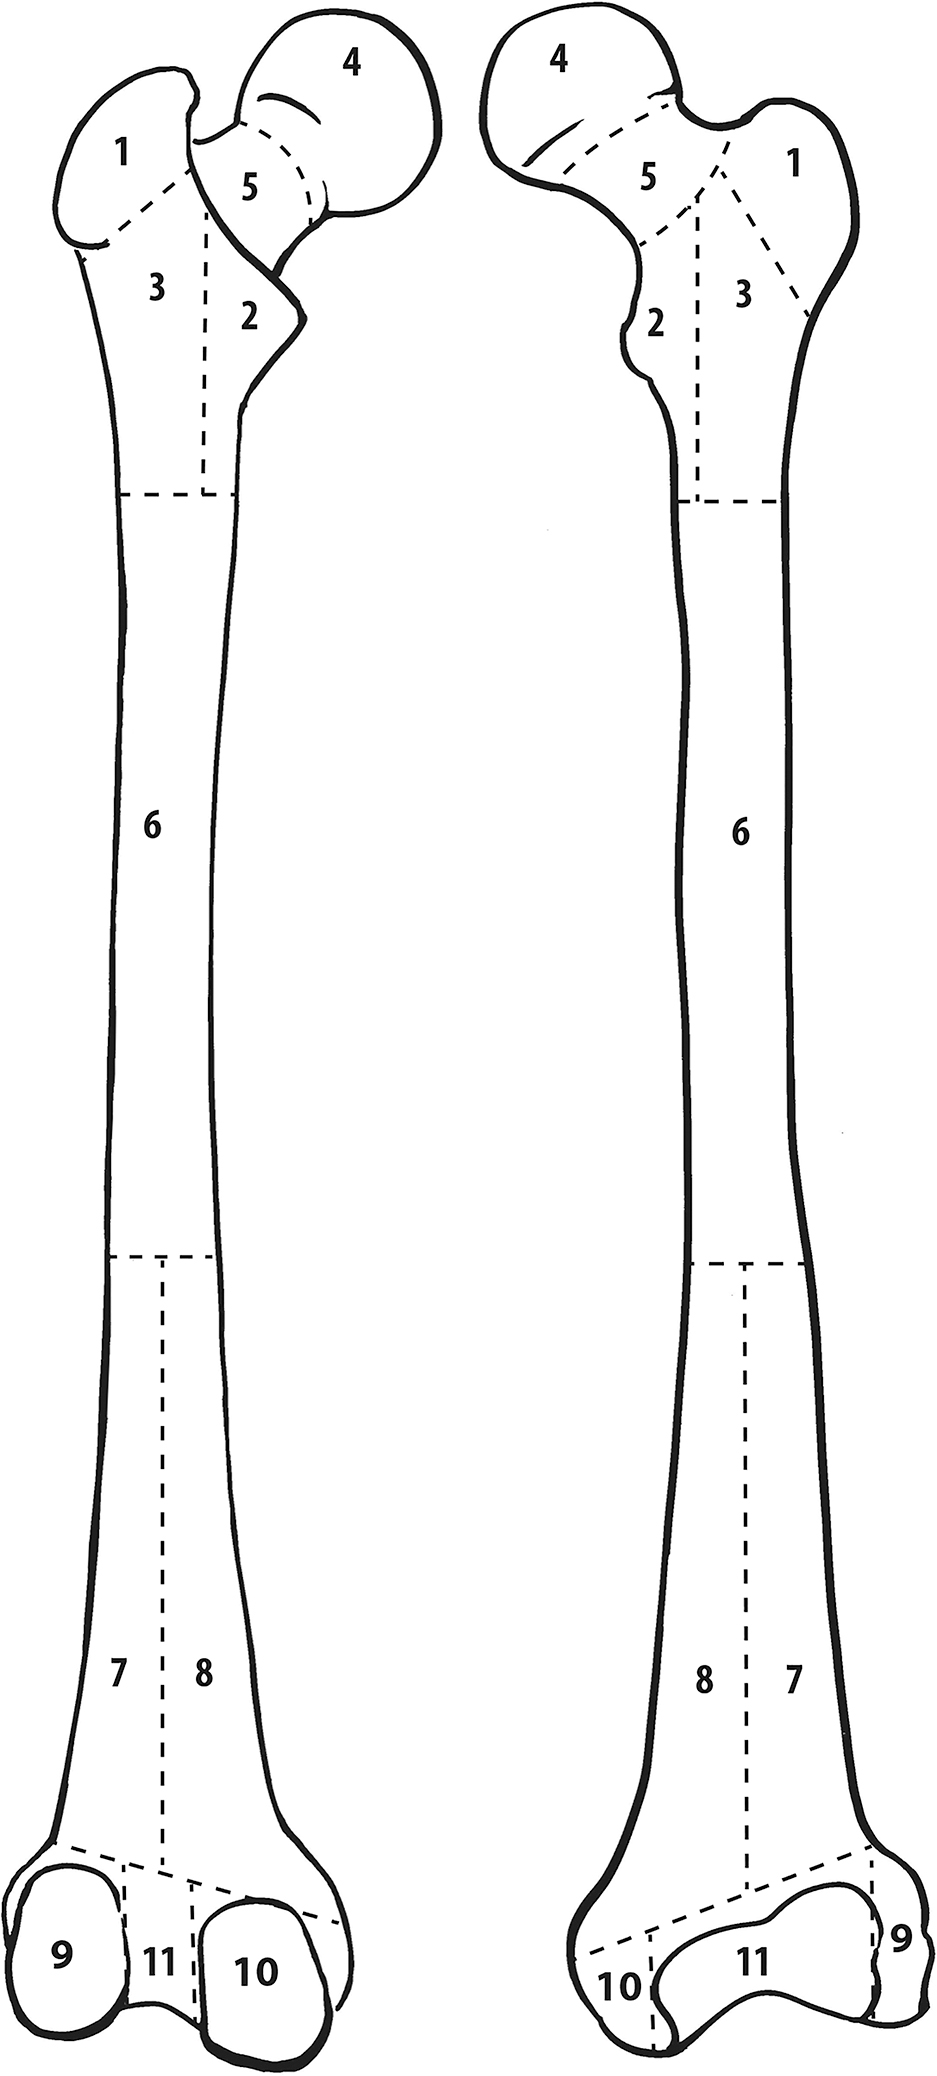
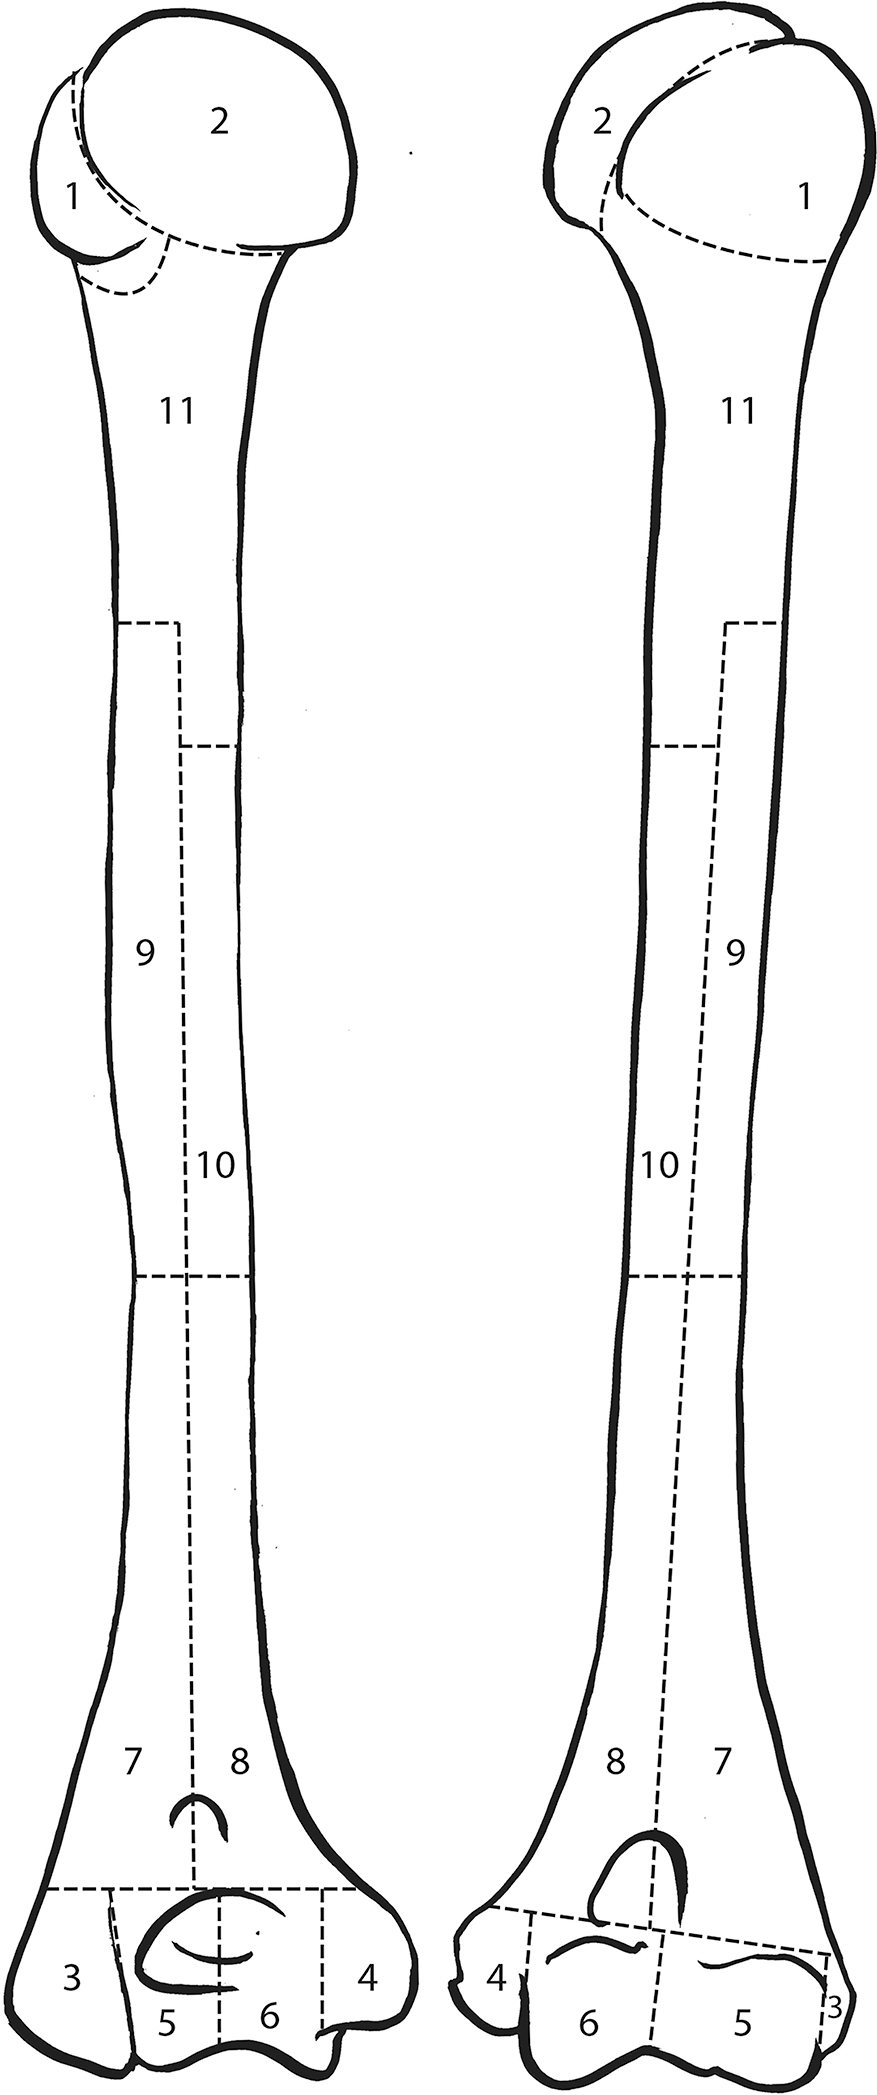
MNE, MNI, and MLNI estimates are represented in Table 2 and Figure 1. Based on the inventory, 357 mostly complete or complete crania are present, but cranial MNE is 364 individuals based on the presence of zone 5 (occipital region; Fig. 2). The right distal femur is the most common portion based on traditional reporting (336 individuals), but femoral MNE is 343 based on the presence of zone 2 (lesser trochanter region; Fig. 3). The right distal humerus is the most common portion based on traditional reporting (289 individuals), but humeral MNE is 292 based on the presence of zone 5 (lateral epicondyle region; Fig. 4).
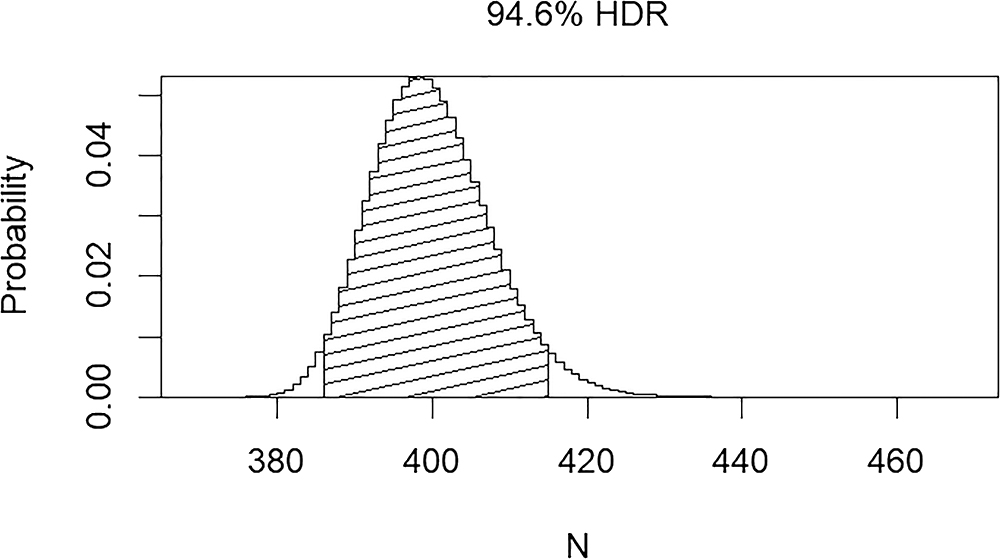
LeGarde identified 211 humeri pairs in the pair-matching study (see LeGarde 2019). Based on this assessment, the GMT is estimated as 369. When the pair-matching data are used to calculate the MLNI, the result is 398 with the 95% HDR encompassing 385–414 individuals (Fig. 5). Additionally, a total of 310 unique mtDNA sequences based on HV1 and HV2 results are associated with the project as of February 2018 (2,980 samples processed). When duplicated elements per mtDNA sequence are considered, MNI is 400.
The results indicate variability between MNE, MNI, and MLNI estimates (see Table 2, Fig. 1). MLNI (398) and MNI based on the number of duplicated elements per mtDNA sequence (400) provide the highest estimates, while traditional MNI reporting results in the lowest estimates.
Discussion
In this assemblage, MNI by duplicated elements per mtDNA sequence and MLNI provide estimates that are nearly identical to the expected historical population size. GMT is the next most accurate method, followed by MNE based on zones. As expected, the low degree of fragmentation results in similar estimates for traditional and zonal MNE; however, zonal MNE is consistently higher than traditional estimates among all elements.
TABLE 2—Estimated Number of Individuals (MNE, MNI, and MLNI) for the USS Oklahoma Assemblage.
|
Element |
Method |
Description |
Estimated Number of Individuals |
|||
|
Duplicated elementsa |
MNI: mtDNA |
— |
400 |
|||
|
Humeri |
MLNI |
— |
398 (95% HDR 385–414) |
|||
|
Humeri |
MNI: GMT |
— |
369 |
|||
|
Cranium |
MNE: Zonation |
Zone #5 |
364 |
|||
|
Cranium |
MNE: Traditional |
Mostly complete |
357 |
|||
|
Right femur |
MNE: Zonation |
Zone #2 |
343 |
|||
|
Right femur |
MNE: Traditional |
Distal portion |
336 |
|||
|
Right humerus |
MNE: Zonation |
Zone #5 |
292 |
|||
|
Right humerus |
MNE: Traditional |
Distal portion |
289 |
aBased on duplicated elements per mtDNA sequence (310 sequences from 2,980 samples, as of February 2018).
FIG. 1—Estimated number of individuals (MNE, MNI, and MLNI) for the USS Oklahoma assemblage, where DE = duplicated elements, Z = zonation method, and T = traditional method.
FIG. 2—Cranium divided into zones, following the Knüsel and Outram method (illustration by Nandar Yukyi and Emily Streetman).
FIG. 3—Femur divided into zones, following the Knüsel and Outram method (illustration by Elizabeth Lockett).
FIG.4—Humerus divided into zones, following the Knüsel and Outram method (illustration by Elizabeth Lockett).
FIG.5—The most likely number of individuals (MLNI) with the 95% HDR for the USS Oklahoma assemblage.
The accepted MNI, determined by duplicated elements per mtDNA sequence, provides the most accurate number of individuals associated with this assemblage when considering the number of individuals unidentified following the incident. Because this number is slightly higher than the expected loss number of 394, it could indicate that some individuals were mistakenly associated with the Oklahoma upon recovery, individuals not listed as Oklahoma casualties were on board the ship at the time of the incident, and/or portions of previously identified individuals are present in the current assemblage.
While MNI by duplicated elements per mtDNA sequence is the most accurate, the DNA testing for the project is not yet complete; approximately 60% of the total sampled elements were used to estimate the original population size. It will likely take at least another year to process the remaining samples and conduct additional nuclear DNA testing. Thus, MNI by duplicated elements per mtDNA sequence does not represent the timeliest or most cost-effective strategy, and given that samples are still in analysis, MNI may fluctuate as more DNA results are received.
A challenge for both MLNI and GMT is that these methods necessitate accurate pair-matching across the entire assemblage. LeGarde’s study indicates that accurate large-scale pair-matching is feasible; therefore, this method can be used to estimate GMT and MLNI. However, this may not be possible for all assemblages, and if assemblage size, time limits, and/or condition of the remains precludes the use of pair-matching, the zonation method provides a reliable, easily applied alternative.
Despite the low level of fragmentation (see Table 1), zonal MNE outperformed traditional MNE estimates for all tested elements. The zonation method provides a replicable means to assess fragmented remains, regardless of the degree of fragmentation or the number of analysts working on a project. Additionally, the zonation method is standardized, unlike estimates based on traditional and more subjective reporting techniques. Because the zonation method can be used accurately where other methods are precluded, it is valuable for forensic contexts. Compared to DNA, it is also relatively inexpensive, requiring only the analysts’ time.
The MLNI assessment is consistent with the accepted MNI and the historical estimate, and it corroborates previous findings (Konigsberg & Adams 2014), but on a larger scale. With a humeri recovery rate of approximately 73%, the MLNI results of the USS Oklahoma are in general agreement with previous simulations (Konigsberg & Adams 2014). Considering that fewer humeri were recovered than femora (approximately 73% versus 85% element recovery, respectively; see Tables 1 and 2), it is unknown how MLNI may have been affected if femora had been subjected to pair-matching instead. Furthermore, when using the MLNI for planning purposes, the MLNI value should be preferred over the associated interval. The associated interval may under- or overestimate, which can have negative impacts on planning, resource allocation, field recovery efforts, and analytical approaches.
Conclusion
Resolution of commingled assemblages is critical for individual identification. An important first step in this process is to determine the number of individuals represented in an assemblage, and multiple methods exist to complete this task. Although it is necessary to have various methods to account for the vastly different types of assemblages and taphonomic conditions affecting the associated elements, very few methods have been compared or tested on assemblages of known size.
This study assesses multiple methods of quantifying individuals using remains associated with the Oklahoma assemblage as well as introducing MNI by mtDNA sequence and testing the zonal inventory procedure. Traditional methods provided the lowest estimate in this study, while the alternative methods appear to be more accurate. All of the estimates discussed herein can be calculated fairly easily and provide more accurate results than traditional MNI estimates, although only MLNI and MNI by duplicated elements per mtDNA sequences provided estimates comparable to the historical estimate.
However, among the alternative methods, none is advocated over another, because every osseous assemblage and associated context is different; methods should be considered and applied as appropriate per project. Most importantly, before any individuating estimates can be determined, it is critical to inventory remains in a consistent, standardized way. The Commingled Remains Analytics (CoRA) is a web application that can be used for inventorying commingled human remains assemblages and includes features such as a zone module to assist in MNI calculations. It was developed specifically to address challenges associated with ongoing commingled projects at the DPAA. For more information about CoRA, see Brown (2019).
If time and cost are not an issue, extensive DNA testing and anthropological analysis can be used effectively to estimate the number of individuals present in an assemblage with a high degree of accuracy. When elements are mostly complete, pair-matching can be used to determine GMT and MLNI, both of which can provide relatively accurate estimates. This study did not include pair-matching of the most common contralateral elements, did not test differences in estimates when using more than one element type, and did not assess the feasibility of pair-matching in an assemblage with moderate-to-pronounced fragmentation.
Although it provided a lower estimate than the other alternative methods in this study, the zonation method is replicable, standardized, useful on complete or fragmented assemblages, and it can be implemented where pair-matching and DNA analyses are not options. The zonation method is especially useful in fragmented cases, and therefore can be applied where other methods are precluded. Zonal MNE outperformed traditional MNE even with the low degree of element fragmentation within the assemblage.
Future research, however, should examine the utility of the cranial zones (see Fig. 2). The majority of cranial bones are designated as a zone in and of themselves (e.g., the right and left parietal represent zones 3 and 4, respectively, of the 15 cranial zones). Because we determined that half of a zone must be present to be counted, two halves of the right parietal have the possibility of being counted as two individuals, even if they originate from the same individual. It is possible, therefore, in cases where cranial remains are highly fragmented, for the zonal method to overestimate the number of individuals based on cranial fragments. To ensure a standardized and accurate cranial inventory, future research should explore refining cranial zones or possibly testing other methods, such as the Landmark method (Mack et al. 2016).
Some slight modifications are recommended to the zones from the original article (Knüsel & Outram 2004) based on practice with the method and applicability for commingled assemblages (Appendix A): we renumbered the mandible so that the zones are specific to left and right sides; provided figures for the cranium and mandible separately; updated radius zone “J” to 11 and all ulna letters to numbers for consistency with other elements; changed the carpal and tarsal (except calcaneus and talus) letter scheme to numbers (zone 1 for all carpals); condensed phalanges into a single zone (1) as they are not as probative as other elements and analysis does not greatly benefit from the level of detail that multiple phalanges zones provides; and divided ribs into four zones, breaking zone 3 into shaft (zone 3) and sternal end (zone 4).
The Oklahoma project presents a robust assemblage with a low degree of fragmentation, which provides an optimal platform to assess individuating methods. Additional testing of assemblages with different recovery rates and/or degrees of fragmentation, however, would provide invaluable insight and comparison. Future research should focus on the relationship of recovery rate and estimation of the original population size, including the consideration of what elements are potentially more useful for the resolution of commingling and analyses leading to identification.
Acknowledgments
The views herein are those of the authors and do not represent those of the Defense POW/MIA Accounting Agency, Department of Defense, or United States government. This research was supported in part by appointments to the Postgraduate and Student Research Participation Programs at the Defense POW/MIA Accounting Agency administered by the Oak Ridge Institute for Science and Education through an interagency agreement between the U.S. Department of Energy and DPAA. Portions of this paper were presented at the 70th Annual American Academy of Forensic Sciences meeting in Seattle, WA. The authors would like to acknowledge the contributions of the Armed Forces DNA Identification Laboratory: Franklin E. Damann, Jeffery Lynch, Sarah C. Kindschuh, Sachin Pawaskar, Nandar Yukyi, Emily Streetman, Elizabeth Lockett, Yangseung Jeong, Lara McCormick, Petra Banks, Ashley Burch, and Sarah Shankel.
References
Adams BJ, Konigsberg LW. Estimation of the most likely number of individuals from commingled human skeletal remains. American Journal of Physical Anthropology 2004;125(2):138–151.
Byrd JE, Adams BJ. Analysis of commingled human remains. In: Blau S, Ubelaker DH, eds. Handbook of Forensic Anthropology and Archaeology. 2nd ed. New York: Routledge; 2014:226–242.
Dominguez-Rodrigo M. Critical review of the MNI (minimum number of individuals) as a zooarchaeological unit of quantification. Archaeological and Anthropological Sciences 2012;4(1):47–59.
Gifford-Gonzalez D. An Introduction to Zooarchaeology. New York: Springer; 2018.
Grayson DK. Quantitative Zooarchaeology: Topics in the Analysis of Archaeological Faunas. Orlando: Academic Press; 1984.
Horton D. Minimum numbers: A consideration. Journal of Archaeological Science 1984;11(3):255–271.
Klein RG, Cruz-Uribe K. The Analysis of Animal Bones from Archeological Sites. Chicago: University of Chicago Press; 1984.
Knüsel CJ, Outram AK. Fragmentation: The zonation method applied to fragmented human remains from archaeological and forensic contexts. Environmental Archaeology 2004;9(1):85–98.
Konigsberg LW, Adams BJ. Estimating the number of individuals represented by commingled human remains: A critical evaluation of methods. In: Adams BJ, Byrd JE, eds. Commingled Human Remains: Methods in Recovery, Analysis, and Identification. San Diego: Academic Press; 2014:193–220.
Lambacher N, Gerdau-Radonic K, Bonthorne E, Valle de Tarazaga Montero FJ. Evaluating three methods to estimate the number of individuals from a commingled context. Journal of Archaeological Science: Reports 2016;10:674–683.
Lyman RL. A critical review of four efforts to resurrect MNI in zooarchaeology. Journal of Archaeological Method and Theory 2018; Early View. doi: 10.1007/s10816-018-9365-3.
Lyman RL. Quantitative units and terminology in zooarchaeology. American Antiquity 1994;59(1):36–71.
Mack JE, Waterman AJ, Racila A-M, Artz JA, Lillios KT. Applying zooarchaeological methods to interpret mortuary behavior and taphonomy in commingled burials: The case study of the late neolithic site of Bolores, Portugal. International Journal of Osteoarchaeology 2016; 26(3):524–536.
Marean CW, Spencer LM. Impact of carnivore ravaging on zooarchaeological measures of element abundance. American Antiquity 1991;56(4):645–658.
Marshall F, Pilgram T. NISP vs. MNI in quantification of body-part representation. American Antiquity 1993;58(2):261–269.
Nikita E, Lahr MM. Simple algorithms for the estimation of the initial number of individuals in commingled skeletal remains. American Journal of Physical Anthropology 2011;146(4):629–636.
Reitz EJ, Wing ES. Zooarchaeology. 2nd ed. New York: Cambridge University Press; 2008.
Robb J. What can we really say about skeletal part representation, MNI and funerary ritual? A simulation approach. Journal of Archaeological Science: Reports 2016;10:684–692.
Rowbothan SK, Blau S, Hislop-Jambrich J. Recording skeletal completeness: A standardized approach. Forensic Science International 2017;275:117–123.
Sussman E. Comparing Methodologies for Documenting Commingled and Fragmentary Human Remains [master’s thesis]. Greenville, NC: East Carolina University; 2017.
Ubelaker DH. Approaches to the study of commingling in human skeletal biology. In: Haglund WD, Sorg MH, eds. Advances in Forensic Taphonomy: Method, Theory, and Archaeological Perspectives. Boca Raton, FL: CRC Press; 2002: 331–352.
Ubelaker DH. Reconstruction of Demographic Profiles from Ossuary Skeletal Samples: A Case Study from the Tidewater Potomac. Washington, DC: Smithsonian Institution Press; 1974.
White TE. A method of calculating the dietary percentage of various food animals utilized by aboriginal peoples. American Antiquity 1953;18(4):396–398.
1. Remains were interred in bundles, with multiple bundles of remains per casket. For more information on the historical analyses and interment of the remains, see Brown 2019.
aIndiana University of Pennsylvania College of Humanities and Social Sciences—Anthropology, Indiana, PA, USA
bDefense POW/MIA Accounting Agency, Joint Base Pearl Harbor–Hickam, Hawai’i, USA
cDefense POW/MIA Accounting Agency—Laboratory, Offutt AFB, NE, USA
dUniversity of South Florida, Anthropology, Tampa, FL, USA
*Correspondence to: Andrea Palmiotto, Indiana University of Pennsylvania College of Humanities and Social Sciences—Anthropology, McElhaney Hall Rm G1 1011 South Drive, Indiana, PA 15705, USA
E-mail: apalmiot@iup.edu
Received 7 June 2018; Revised 9 August 2018; Accepted 29 August 2018
Appendix A. Updated Images of Zones for Use in Forensic and Bioarchaeological Cases, Based on the Knüsel and Outram Method
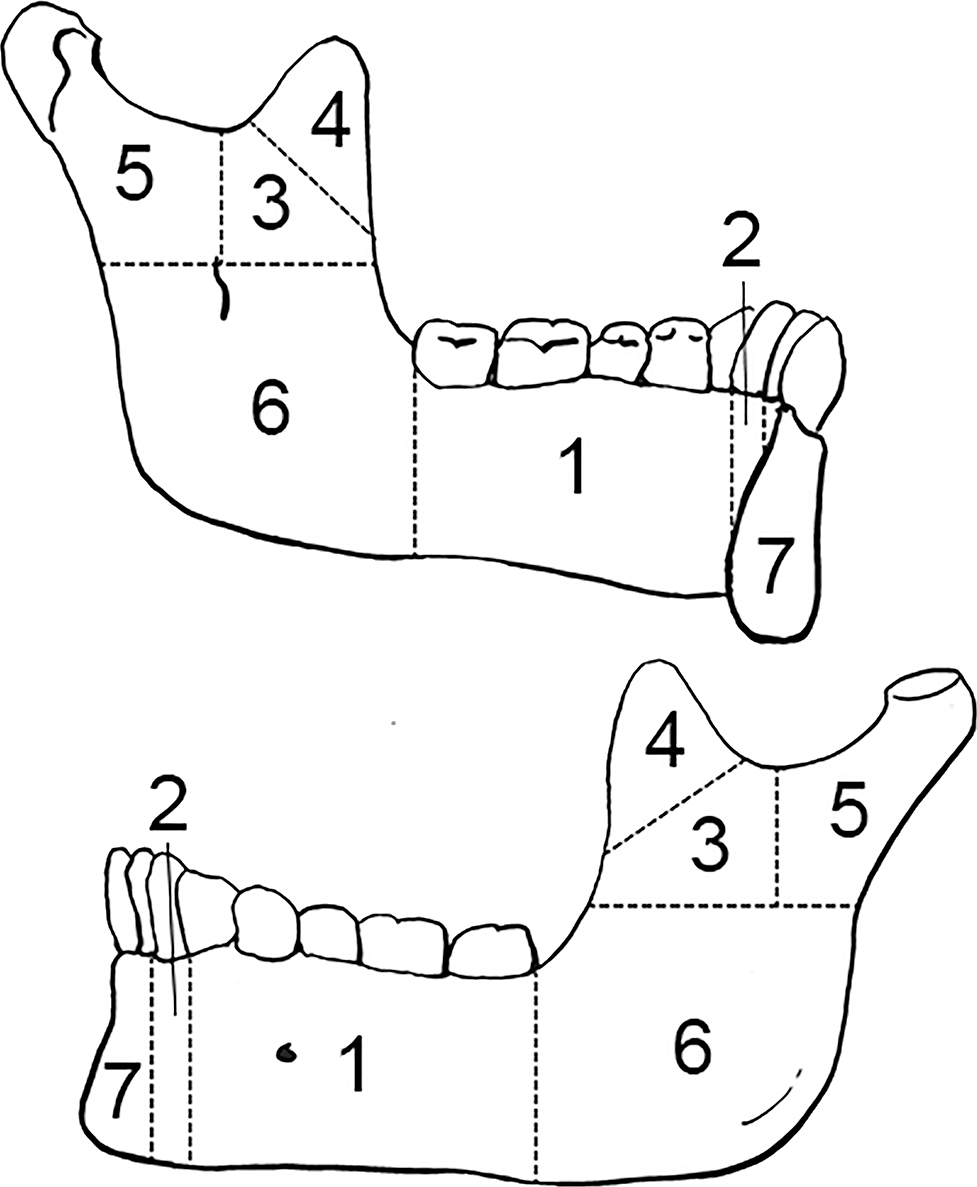
FIG. A1—Left mandible divided into zones, following the Knüsel and Outram method (illustration by Nandar Yukyi and Emily Streetman).
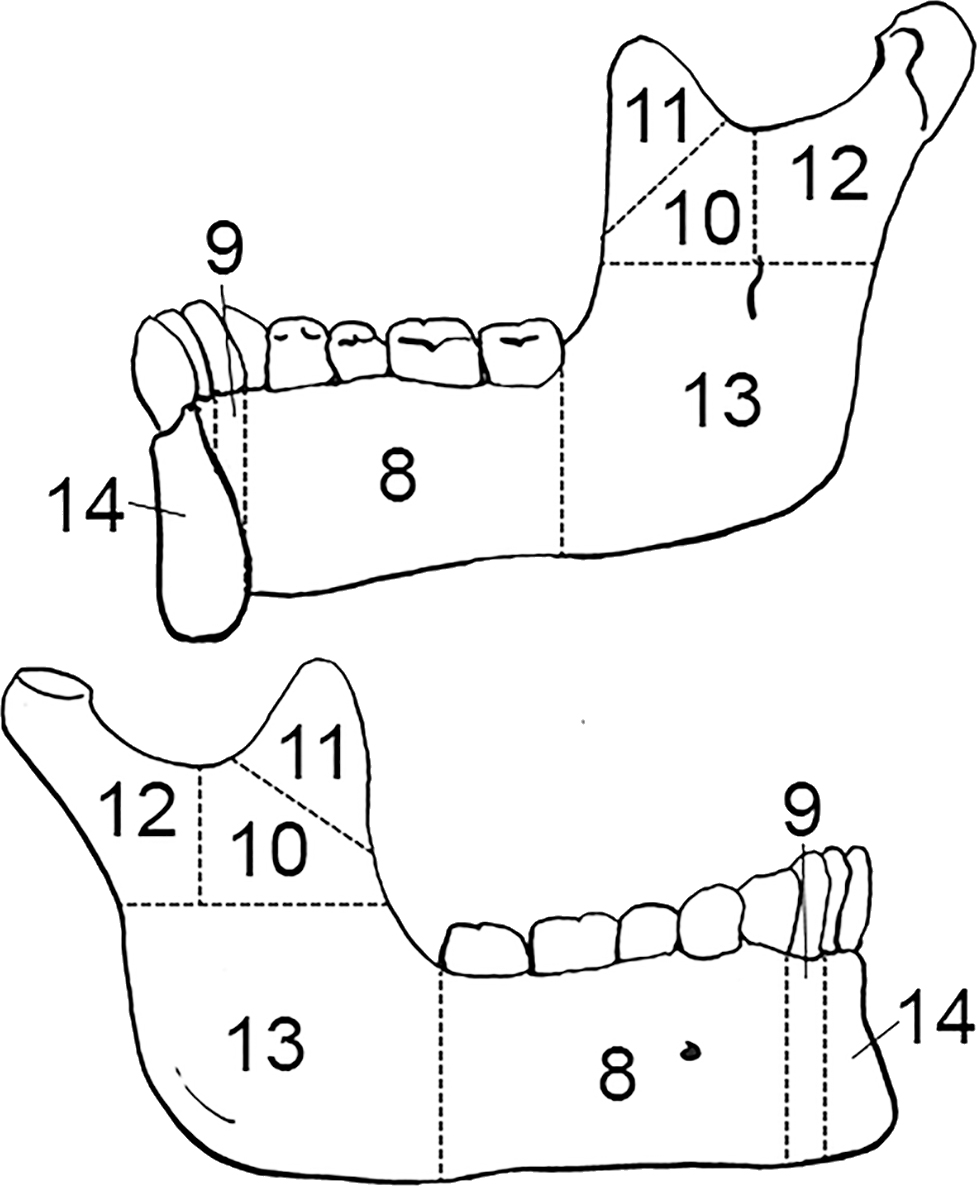
FIG. A2—Right mandible divided into zones, following the Knüsel and Outram method (illustration by Nandar Yukyi and Emily Streetman).
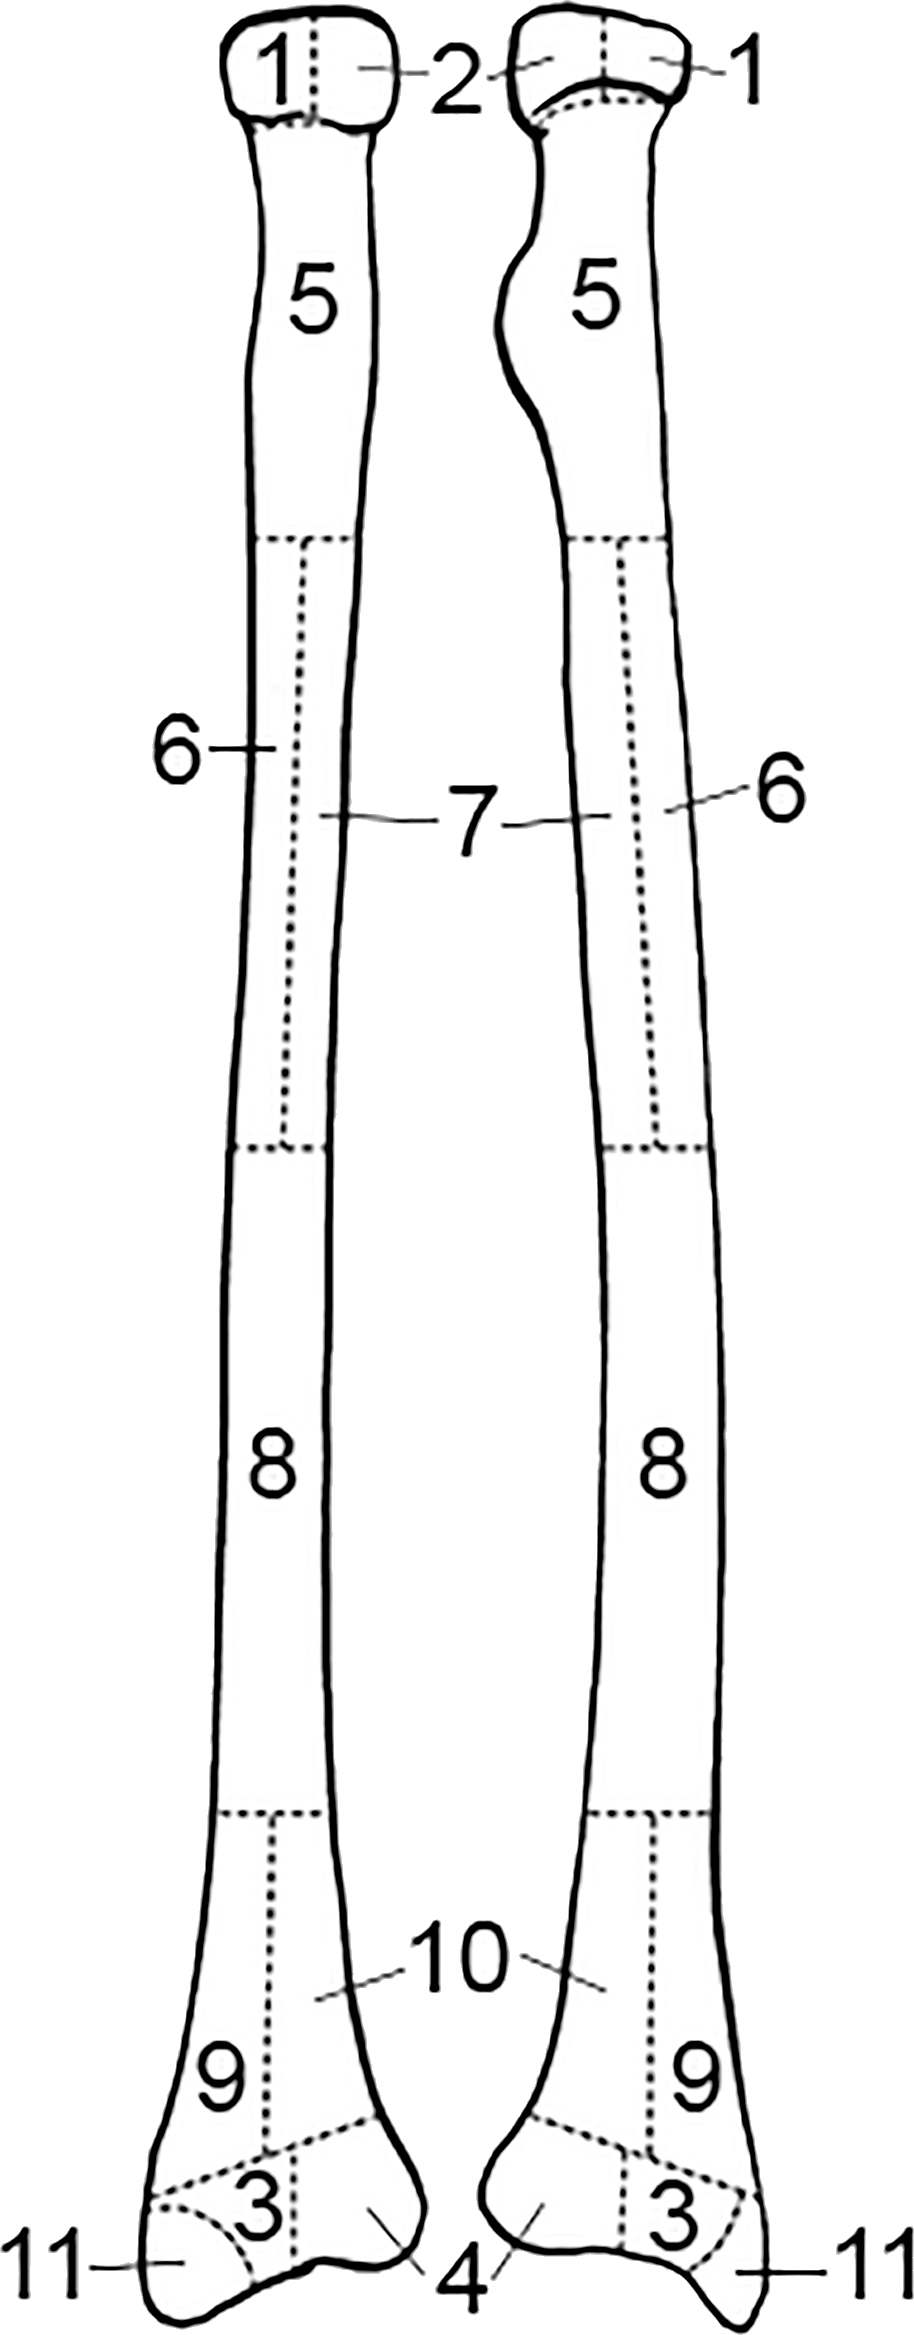
FIG. A3—Radius divided into zones, following the Knüsel and Outram method (illustration by Nandar Yukyi and Emily Streetman).
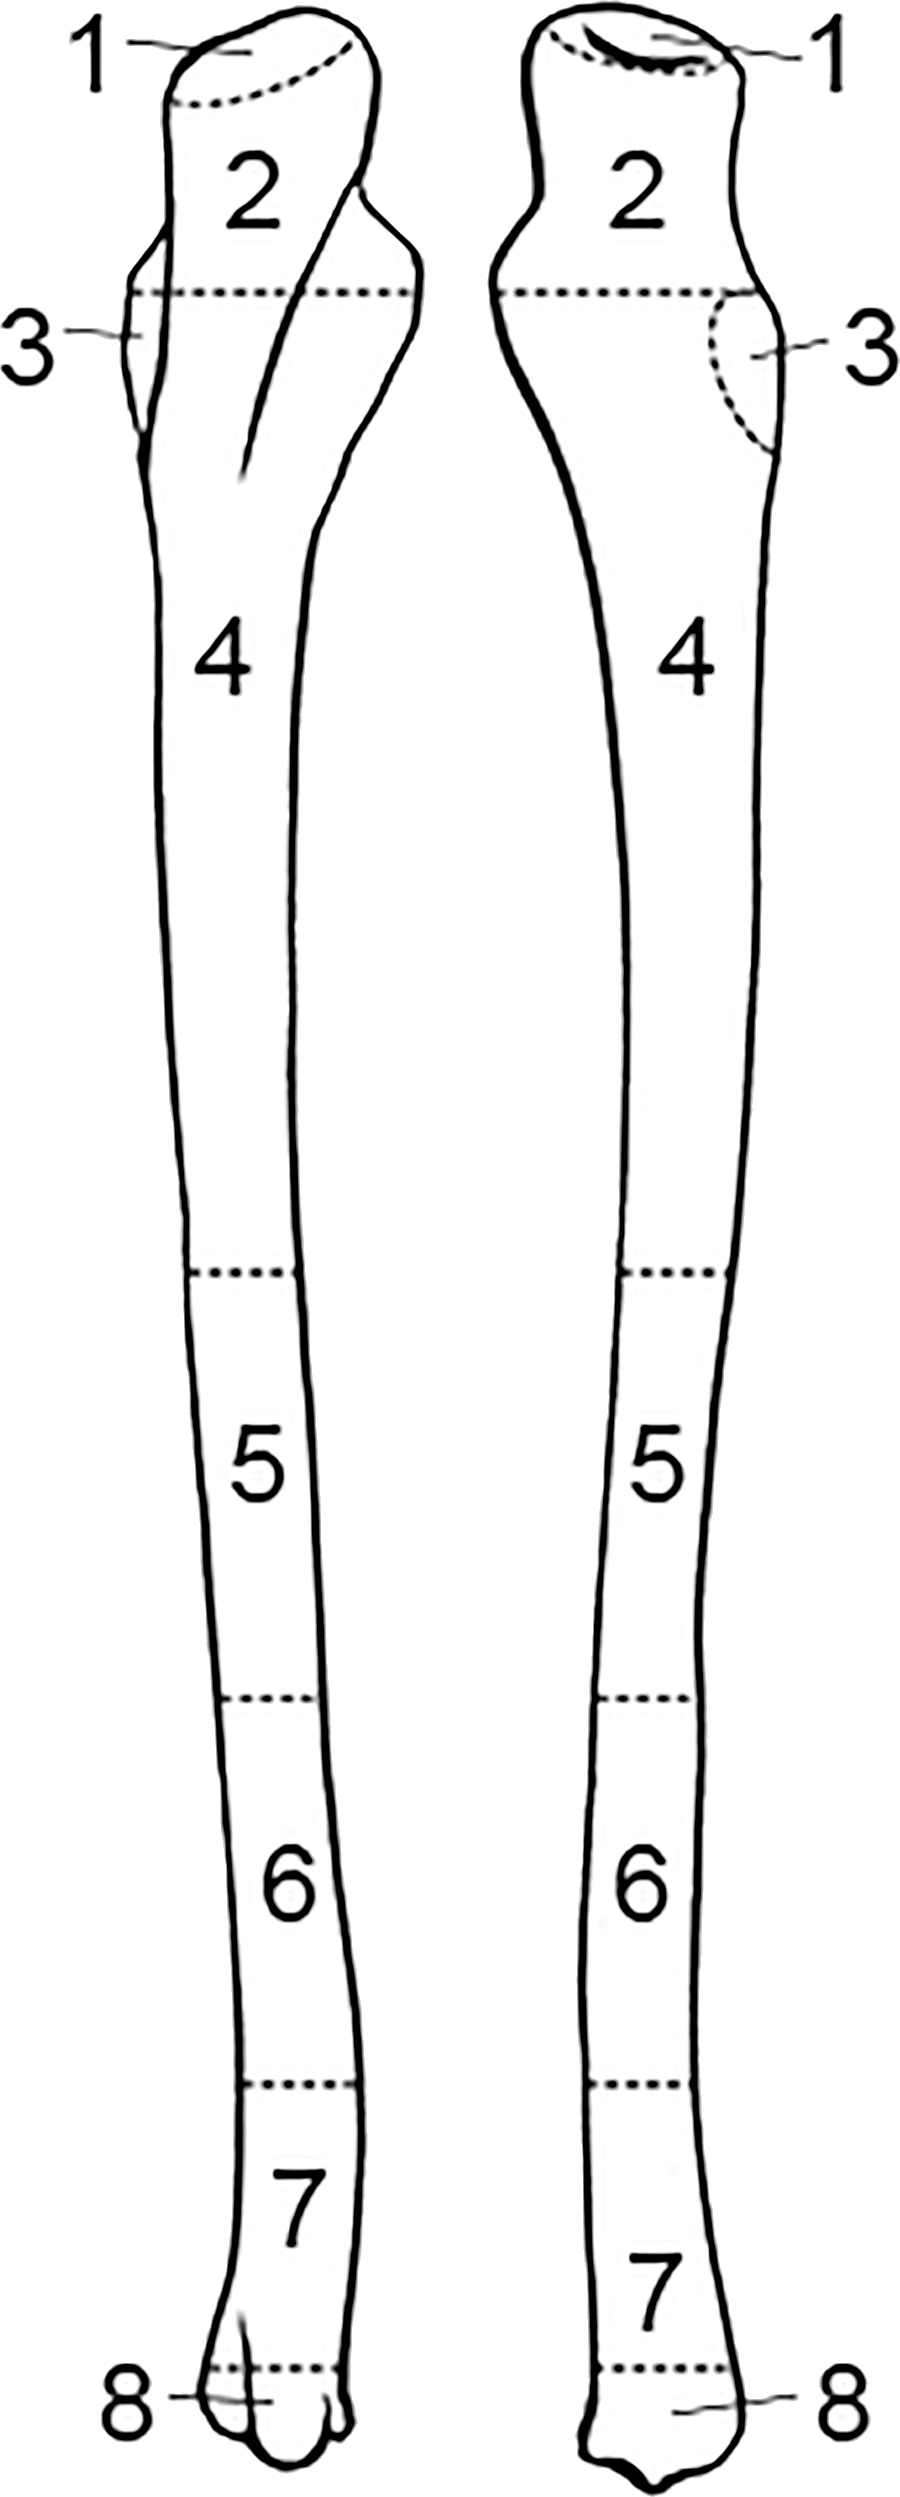
FIG. A4—Ulna divided into zones, following the Knüsel and Outram method (illustration by Nandar Yukyi and Emily Streetman).
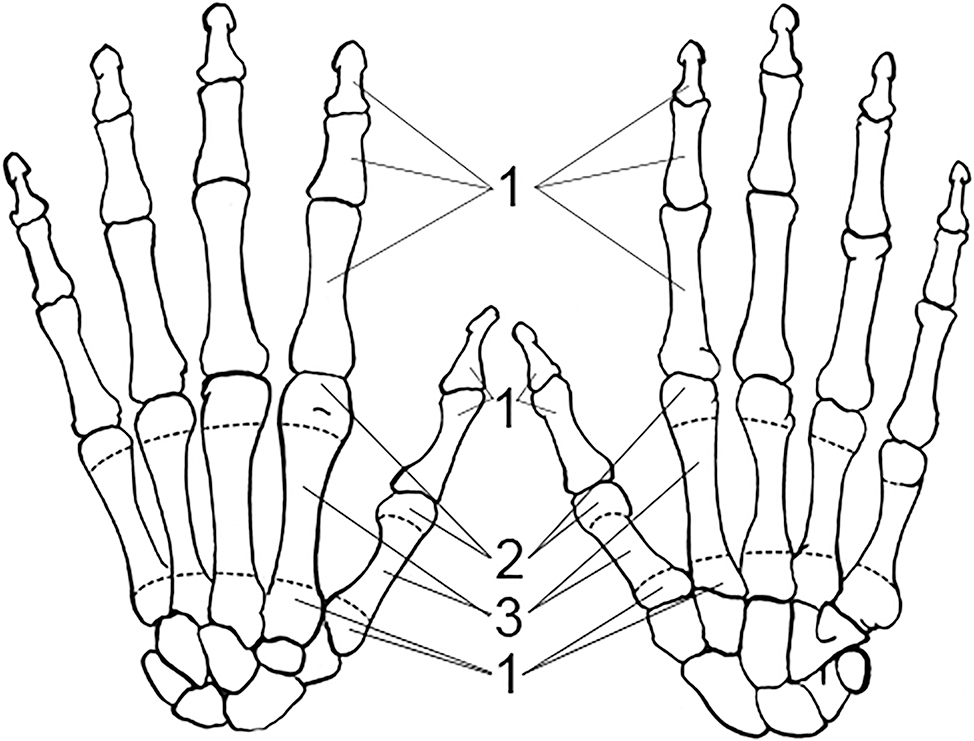
FIG. A5—Bones of the left hand divided into zones, following the Knüsel and Outram method (illustration by Nandar Yukyi and Emily Streetman).
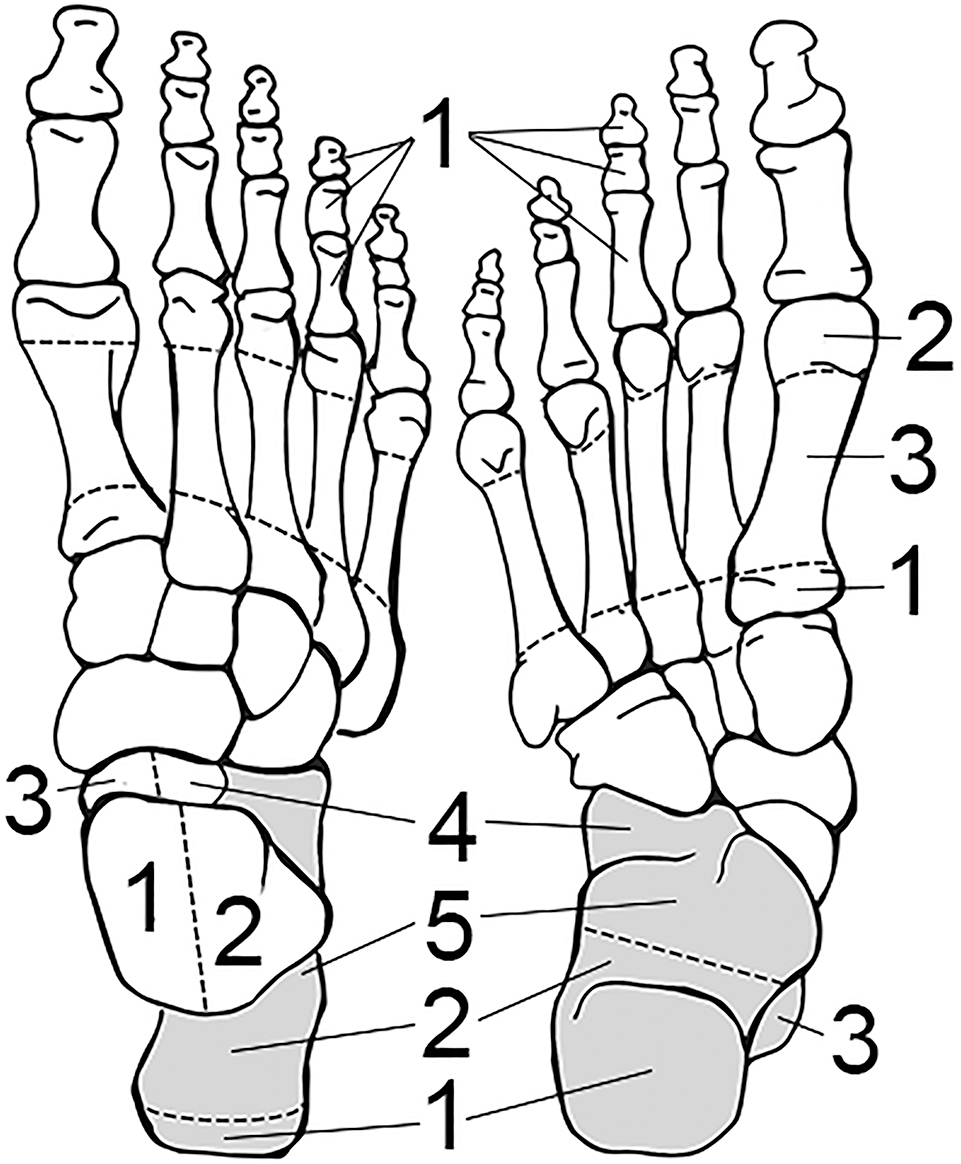
FIG. A6—Bones of the right foot divided into zones, following the Knüsel and Outram method (illustration by Nandar Yukyi and Emily Streetman).
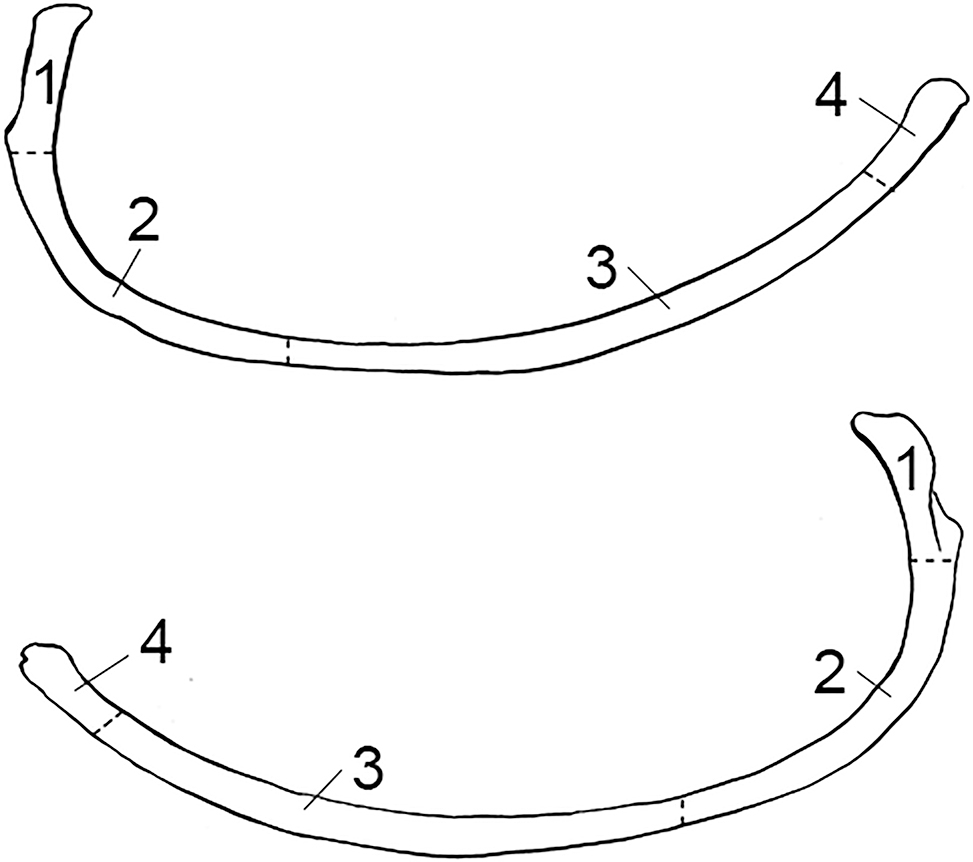
FIG. A7—Rib divided into zones, following the Knüsel and Outram method (illustration by Nandar Yukyi and Emily Streetman).
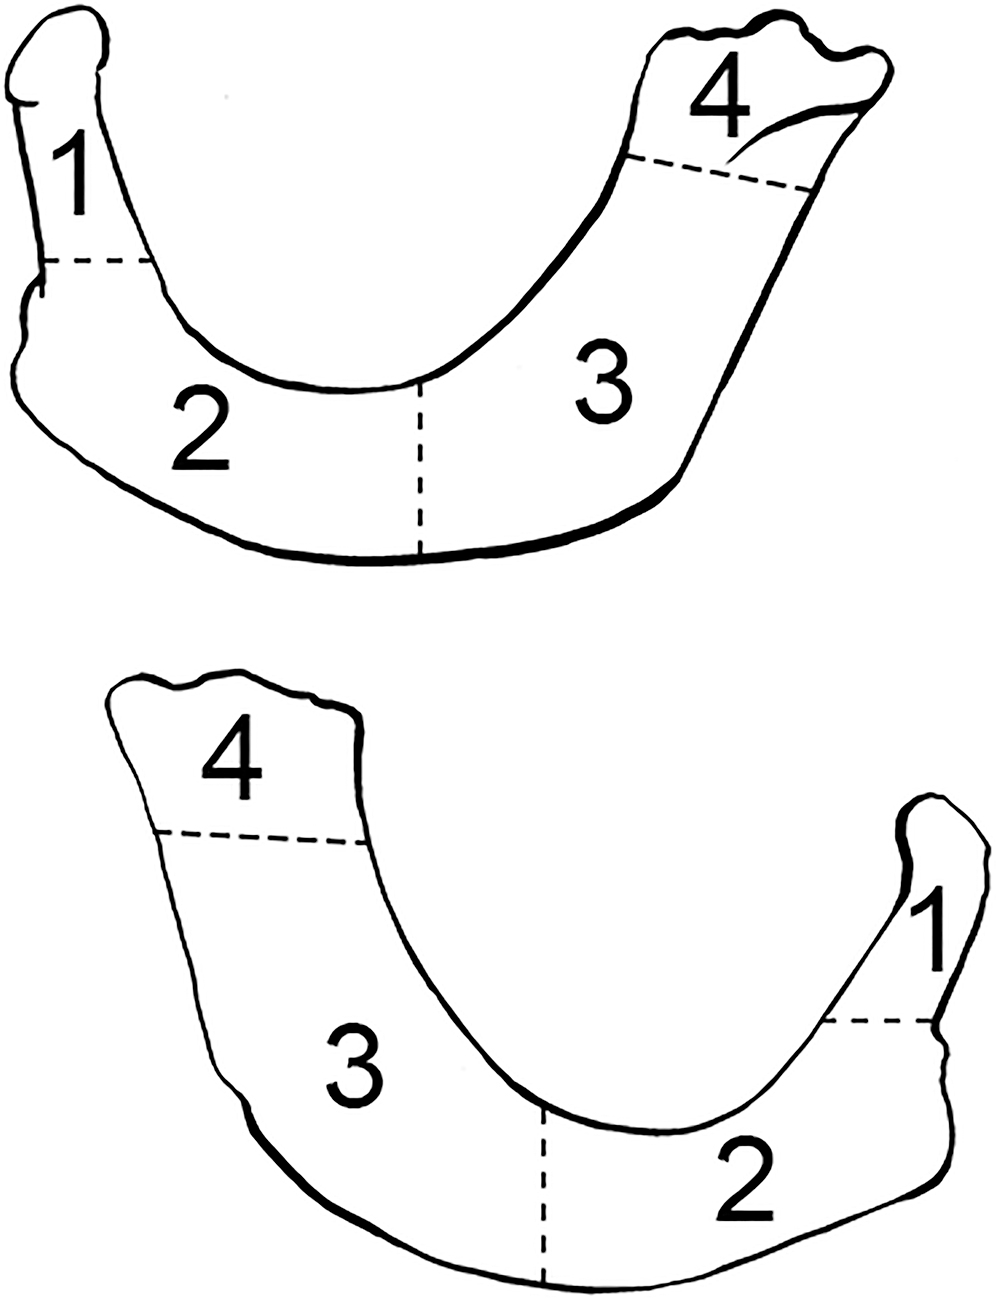
FIG. A8—First rib divided into zones, following the Knüsel and Outram method (illustration by Nandar Yukyi and Emily Streetman).