Forensic Anthropology Vol. 4, No. 4: 309–318
DOI: 10.5744/fa.2021.0017
RESEARCH ARTICLE
What Are We Really Estimating in Forensic Anthropological Practice, Population Affinity or Ancestry?
Kate Spradleya* ● Richard L. Jantzb
ABSTRACT: While American forensic anthropologists often state that they estimate ancestry, is that what they are really estimating? Although typological terminology, the oids, was replaced with continental terminology, the change was linguistic rather than substantive. The American population is comprised largely of immigrants. Genetic data suggests a high degree of admixture within American population groups. Further, data from documented skeletal collections suggest that Americans have undergone secular changes. Our paper addresses the uniqueness of the American population as compared to ancestral continental and geographic origin groups to address what it is that forensic anthropologists are really estimating, ancestry or something else? We conclude, based on uniqueness of American population groups, that what forensic anthropologists are estimating is best described as affinity, a term that indicates similarity and is not exclusively attached to definitions of race and ethnicity.
KEYWORDS: forensic anthropology, population affinity, ancestry, craniometric, anthropological genetics, biological distance
“If we wish to get the greatest efficiency in forensic identification, we should stop trying to do it in a way in which the very real local variation becomes mere static to confuse the results, and try to do it in a way in which local variation makes a positive contribution to correct diagnosis.” (Brues 1992:127)
Introduction
Though it has been stated that it is not possible to sort humans into more categories than continental origins (Williams et al. 2005), forensic anthropologists do this all the time, often working within a continent. Forensic anthropologists commonly refer to this practice as ancestry estimation. But is ancestry what we are really estimating? What we call ancestry and how we refer to it, harkens back to 19th-century racial typology—when skulls were observed and forced into one of three to five groups. Then along came the Modern Synthesis which shifted the focus from categorization to exploration of phenotypic diversity through an evolutionary lens (Huxley 1942). Inspired by Huxley, Sherwood Washburn proposed the New Physical Anthropology (1951) which brought the tenants of the Modern Synthesis into biological anthropology. With this paradigm shift and to distance ourselves from the typology of the past, biological and forensic anthropologists changed the terms Caucasoid, Mongoloid, and Negroid, to European, Asian, and African. This was a small step to distance the discipline from the typology, as was the use of the term ancestry as a replacement for the word race. However, the change in terminology was a substitution of names while, at the time, maintaining the status quo with the often used three group model. New methods of estimation have been developed since the name change, along with data collection representing more diverse population groups. However, the term ancestry estimation is still used frequently in practice, what does it mean and is it what we are really estimating?
Ancestry refers to ancestral origins which could include continental origins or ethnic affiliation. Ancestral categories such as African, Asian, or European are broad and not informative for describing global or local population structure or for use in forensic case work. Although publications have highlighted the uniqueness of United States population groups with respect to migration, gene flow, genetic drift, and secular change, (Edgar 2009; Manthey et al. 2017; Ross et al. 2003; Spradley et al. 2008; Tise et al. 2014) the notion of continental ancestry persists. Ousley et al. (2009) among others, demonstrated that population groups can be accurately classified, using craniometric data, into social race categories within the United States (U.S.), by time period, ethnic affiliation, and geographic boundaries further demonstrating that ancestry (i.e., categorization into African, Asian, and European) is not what forensic anthropologists are estimating. Yet, despite evidence to the contrary, introductory textbooks frequently suggest that forensic anthropologists, in practice, are estimating continental ancestry (Bass & Trimble 2005; Black & Ferguson 2011; Byers 2016; Christensen et al. 2019; Gill & Rhine 1990; Klepinger 2006).
The term population affinity is an estimation of group membership indicating morphological or genetic similarity to a well-defined group and is based on some measure of statistical distance. Recent publications highlight an increase in the use of this term (Berg & Ta’ala 2014; Pilloud & Hefner 2016; Ross et al. 2004; Ross et al. 2011). Forensic anthropologists are good at estimating population affinity within the U.S. because assortative mating practices shaped by miscegenation laws, racism, and social class have shaped our current population structure (Gross & Edgar 2021). The ability of forensic anthropologists to estimate population affinity is an application of anthropological genetic studies, however this is rarely if ever discussed within forensic anthropology textbooks and neglected in the broad literature with the exception of a few (Algee-Hewitt & Goldberg 2016; Relethford 2009).
The purpose of this paper is to explore American population structure through comparison with ancestral groups to provide further insight to the estimation of population affinity and how it differs from ancestry.
Background
Forensic anthropologists in the U.S. can estimate population affinity because of population structure. Population structure refers to the genotype and phenotype frequencies that reflect mating structures. Population structure has long been studied by both population geneticists and anthropologists. Population geneticists study the genetic composition of populations, including changes in genotype and phenotype frequency resulting from the evolutionary processes of selection, genetic drift, mutation, and gene flow over time. Anthropological geneticists focus on biocultural processes relating to genetic and environmental interactions at the population level, most often studying the normal variation of complex traits (Crawford 2007), including craniometric data. Further, anthropological genetic analyses include theoretical models to test hypotheses focusing on microevolutionary processes related to population history (Relethford & Lees 1982:113). Anthropologists have long been at the forefront of studying the cultural and behavioral factors that impact population structure through the study of anthropological genetics (Algee-Hewitt & Goldberg 2016; Crawford 2001, 2007; Livingston 1958; Relethford & Lees 1982). Anthropological genetics uses model-bound methods to test hypotheses concerning human evolution, selection, and population differentiation (Algee-Hewitt & Goldberg 2016:558). However, model-free methods explore population structure when testing explicit models of gene flow and drift are not central questions. Human behavior, influential on human history, is not static and as such, neither are populations. Population size, migration, and secular change all impact population structure.
The U.S. has a generally well-documented population history with an ever-changing population structure that has been the focus of much research (Algee-Hewitt 2017; Bryc et al. 2015; Go et al. 2019; Reich et al. 2012). Archaeological and historical documentation provides knowledge of the ancestral origins of the current population groups within the United States. The narrative of these origins is largely supported by early studies of classical genetic markers and elaborated on through more recent studies focusing on genome sequencing. Using SNP data with self-reported U.S. Census Bureau categories, Bryc et al. (2015) found that African Americans are genetically similar to Africans with variable amounts of European admixture and detectable, although low proportions of Native American admixture. Previous studies have specifically linked the African ancestry to West Africa (Baharian et al. 2016; Bryc et al. 2010) which is also consistent with historical narrative. Further, there is detectable structure in the variation of European admixture; African Americans in the Southeast have less European admixture than in the North and West (Baharian et al. 2016; Bryc et al. 2010).
The U.S. Hispanic1 population is the second largest population group with the majority of the population having geographic origins in Mexico, Puerto Rico, El Salvador, and Cuba (Noe-Bustamante 2019). Further, foreign born individuals comprise a significant portion of these population groups, Mexican (31%), Salvadoran (57%), and Cuban (56%) (Noe-Bustamante 2019). Genetic studies highlight the complex population structure of Hispanic origin countries which influences further structure within the United States. Mexico exhibits clinal variation with higher amounts of European admixture in the north and less in the central and peninsular region (Ruiz-Linares et al. 2014), which has been documented with genetic and quantitative data (Rubi-Castellanos et al. 2009). Puerto Rico and Cuba also have documented complex genetic structures with differing levels of Native American, European, and African admixture resulting from unique population histories while more African admixture is found in Cuba and Puerto Rico (Cintado et al. 2009; Hanis et al. 1991). Thus, the U.S. Hispanic population is not genetically homogenous, rather it is complex with detectable structure evident across the country. European Americans have considerable admixture with other European groups and with African and Native Americans, although in relatively small amounts (Bryc et al. 2015).
In addition to the influences of population history and gene flow on population structure, skeletal secular changes have been documented in African and European Americans (Jantz 2001; Jantz & Meadows Jantz 2016). In particular, an increase in cranial base height has provided an increase in overall vault height for both groups (Jantz 2001; Wescott & Jantz 2005) along with vault width and cranial base length (Jantz & Meadows Jantz 2016). Investigating limb bone allometry in European Americans, Jantz and Meadows Jantz (2017) found that significant changes occurred in a short period of time suggesting that the unique American environment has disrupted developmental canalization. Although significant secular changes in skeletal morphology have occurred over the past century, such changes do not obscure underlying genetic structures (Relethford 2004) and support the use of skeletal morphology in exploration of population structure.
Given the complex population history, varying degrees of genetic admixture among all U.S. groups, and secular changes in skeletal phenotype due to a unique American environment, are American population groups similar to their ancestral populations? In the following analyses we use craniometric data and biological distance analysis to explore the pattern of quantitative variation among individuals who self-identified into three U.S. Census Bureau racial and ethnic categories and geographically defined population groups in the U.S. (African American, Hispanic American, and European American) as compared to their ancestral geographic origin groups. The resulting structure from the biological distances will be discussed within the framework of the ancestry vs the affinity of local populations.
TABLE 1—Sample Groups
|
Group |
Female |
Male |
Time Period |
Curator /Reference |
||||
|
African Gold Coast Ashanti Cameroon Calabar Dogon Togo South African |
10 13 10 7 52 7 44 |
10 17 31 16 47 28 57 |
19th Century 19th Century 19th Century 19th Century 17th–18th Centuries 19th Century 20th Century |
American Museum of Natural History ” ” ” https://web.utk.edu/~auerbach/HOWL.htm Berlin Society for Anthropology, Ethnology and Prehistory 20th Century |
||||
|
American African American American/Hispanic European American Zuni |
101 13 169 20 |
171 59 343 24 |
20th Century 20th Century 20th Century 16th–17th Centuries |
Forensic Anthropology Data Bank ” ” Smithsonian Institution |
||||
|
Asian Japan Hainan |
55 38 |
64 45 |
20th Century 18th–19th Centuries |
|||||
|
European Croatian Czech German Italian Portuguese |
0 35 21 114 64 |
31 44 58 106 68 |
20th Century 19th Century 19th Century 20th Century 20th Century |
Vienna Natural History Museum Vienna Natural History Museum and Charles University Smithsonian Institution and Charite Anatomy Cattaneo et al. 2018 Weisensee 2008 |
||||
|
Latin American Mexican Migrant Mexican Mayan Guatemalan Migrant Guatemalan Mayan |
15 20 15 0 |
156 42 25 74 |
20th Century 20th Century 20th Century 20th Century |
Mexican, Guatemalan, and Migrant Craniometric Dataset ” ” Forensic Anthropology Foundation of Guatemala |
Materials and Methods
Craniometric data from U.S. and worldwide groups (Table 1) are used to generate biological distances. U.S. groups represent self-reported or next-of-kin-reported group labels that fit within the Office of Management and Budget’s (OMB) Statistical Directive No. 15 that outlines race and ethnic categories for federal bureaucratic reporting purposes. These categories are also used by the National Missing and Unidentified Persons System or NamUs, which is a national missing and unidentified persons database used in medico-legal investigations. The OMB does not capture the range of variation or local group level for all U.S. citizens. However, it does capture the most often used terminology employed by forensic anthropologists when providing estimates of group membership for the biological profile. The data utilized in the subsequent analyses for American groups were based on availability and represent the three largest population groups in the U.S., African American, Hispanic American, and European American. There is currently a lack of skeletal data available for Asian Americans and contemporary Native Americans. However, with the development of New Mexico Decedent Image Database (https://nmdid.unm.edu/) and other large datasets derived from CT images (Colman 2019; Stull 2020), such data should increase in the future.
Population Groups and Data
Craniometric data (following definitions outlined in Howells 1973) from African American, European American, and Hispanic Americans come from the Forensic Anthropology Data Bank (https://fac.utk.edu/background/) and represent 20th-century birth years. These groups consist of positively identified individuals with self-reported or next of kin reported affinity. Although self-reported and next of kin reported mostly consist of the terms Black or White, in this paper we use the terminology African American and European American to convey the combination of ancestry and geographic birthplace/nationality. While the African and European Americans were born in the U.S., the Hispanic American sample consists of individual with ancestral ties to Mexico who were either born in the U.S. or born in Mexico and moved to the U.S. shortly after birth.
The West and Central African data were collected from the American Museum of Natural History and were part of the Felix von Luschan collection within the Royal Museum of Ethnology in Vienna, Austria (Smith 2002). The exact time period they represent is unknown, although likely 18th and 19th century (Smith 2002). The Dogon come from the (Howells 1973) craniometric data set and are published online. Togo are part of the von Luschan collection at the Berlin Society for Anthropology, Ethnology and Prehistory. These African data represent primary areas of origin for the enslaved Africans forced to immigrate to the New World. The South African data is from L’Abbé et al. (2013) and comes from the Pretoria Bone Collection.
Latin American data are represented by indigenous Guatemalan and Mexican Mayans and migrants from Mexico and Guatemala that died in U.S./Mexico border states, predominately Arizona and Texas and (Spradley 2020). All Latin American groups, Mexican and Guatemalan Mayan and migrants, have 20th century birth years and are well defined in the literature (Hughes et al. 2017; Spradley 2021). A Southwest Native American group, Zuni, was also included in the analysis in addition to two Asian groups, Hainan (Howells 1989) and Japanese (Dudzik 2015). Native Americans, including Indigenous groups in Mexico and Central America, have Asian ancestry from prehistoric migration (Hughes et al. 2019).
Data from Europe spans the West and East and includes a Czech sample that contains known individuals collected from the Vienna Natural History Museum in Austria and Charles University in the Czech Republic. The Croatian data are from the Vienna Museum of Natural History. Italian data were obtained from Manthey et al. (2018). The Portuguese data come from the New Lisbon Skeletal Collection (Weisensee & Jantz 2011).
Methods
Our research question addresses the pattern of variation among U.S. population groups as related to their ancestral, geographic origins, and as such the purpose is not classification. Rather we explore the pattern of population relationships through biological distance. The U.S. population groups are compared to ancestral and local groups based on historical narrative and supported by genetic studies. African Americans are compared to West and Central Africans, along with European Americans. European Americans are used in lieu of the European groups as the European American sample more closely approximates the population group with contributing gene flow to African Americans. The Hispanic American group is compared to all Latin American and European Americans. The Hispanic comparison also includes Asian and Native American groups due to shared ancestry. European Americans were compared to European groups as well as South Africans as the latter have a similar population history with European Americans.
Analyses were completed following procedures outlined in (Jantz & Spradley 2014) to produce Mahalanobis and Fst distances. Sexes were pooled to increase the overall sample size and sex differences were removed by centering on sex specific means. FORDISC 3.1 was used to generate the covariance matrices and means for each group which were centered and pooled. The eigenvalues and eigenvectors were extracted to obtain the principal component scores to compute Mahalanobis distances (D2) and obtain the canonical variates to create two-dimensional plots. The plots are used to assess population structure and structure coefficients are used to interpret the craniometric variation.
Results
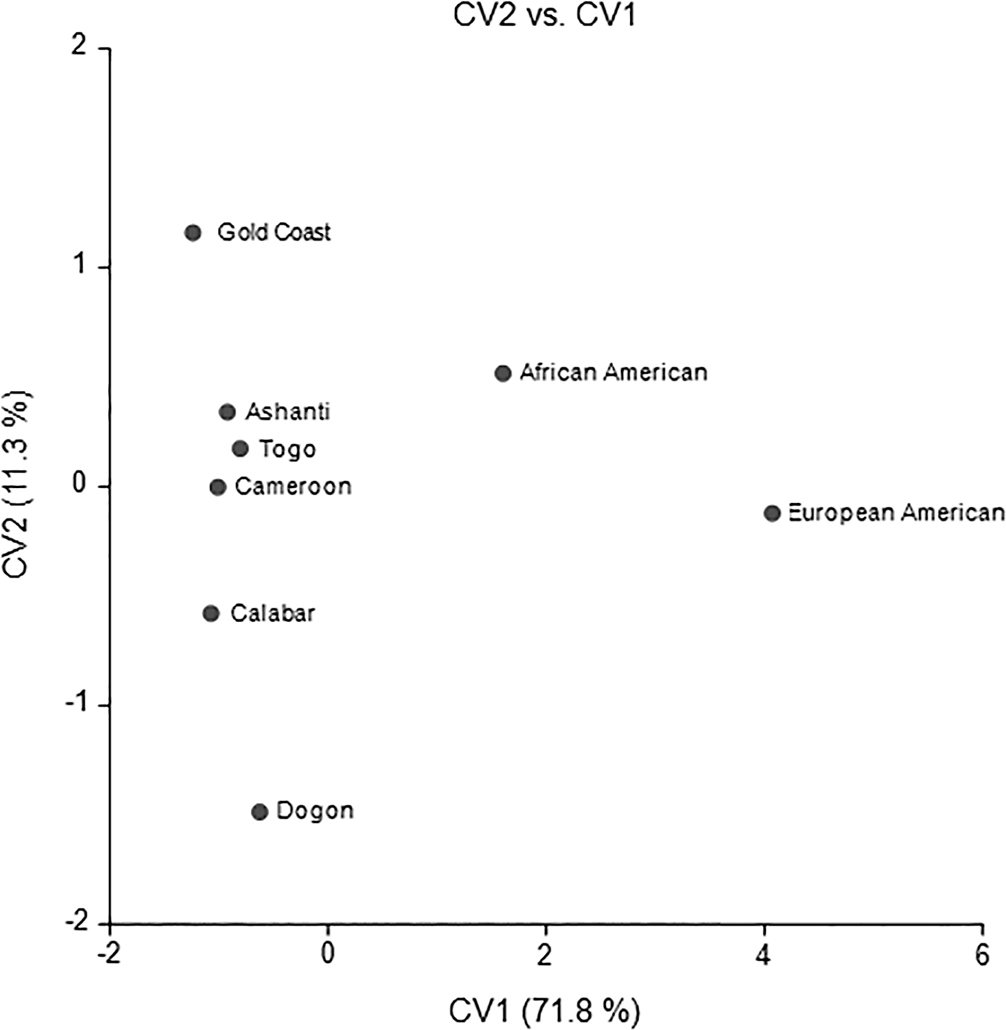
The CV plot featuring African Americans (Figure 1) shows the African American group intermediate to the West and Central Africans and European Americans on the first axis. The second axis highlights geographical patterns among the West and Central African groups with Nigeria (Gold Coast) most differentiated from Mali (Dogon) and situates African Americans with West Africans. Almost all variables contribute to CV1 as indicated by the structure coefficients (see Table 2). The pattern of loadings presents a clear pattern of morphometric variation. High scores on CV1 result from a wide cranial base, long cranial base length and vault height, high nasal height and narrow nasal aperture and interorbital distance. The reverse is the case for low scores on CV1. CV1 reflects a pattern of variation normally associated with African-European variation. High scores on CV2 mainly reflect longer basion-prosthion and basion-nasion lengths, and a longer, narrow cranial vault.
FIG. 1—African American CV Plot.
What is noteworthy in Figure 1 is that African Americans are about equidistant from West Africans and European Americans. This is shown quantitatively in the first column of Table 3. African Americans are slightly more similar to three African groups (Ashanti, Cameroon, and Togo) than to European Americans. But African Americans are slightly more similar to European Americans than they are to three other African groups (Calabar, Dogon, and Gold Coast). The distances show African Americans to occupy the approximate mid-point between Africans and European Americans. The Fst distances in the first row of Table 3 are all around 0.06, presenting the distances as a proportion of total variation attributable to between groups.
The CV plot for Hispanics (Figure 2) situates the U.S.-born group intermediate to European Americans and Latin American and Asian groups, with European Americans the most differentiated. CV1 mainly serves to separate Euro-Americans from the Indigenous Maya groups and Hainan. The second axis separates the Asian groups from all other groups. Considering Hispanic and Latin American groups, the Hispanic American group is most similar to the Mexican migrant group, followed by the Guatemalan migrants and most differentiated from the Mexican and Guatemalan Mayan groups (Table 4). Further, the Mexican and Guatemalan migrant groups are intermediate to Hispanic American and Guatemalan Mayan groups. High scores on CV1 mainly reflect long cranial bases (Table 2), generally long crania with narrow nasal apertures and narrow bizygomatics. CV2 reflects narrow cranial bases and high vaults, small orbits and wide interorbital breadth.
TABLE 2—Structure Coefficients
|
Variable |
African American |
European American |
Hispanic |
|||||||||
|
Can1 |
Can2 |
Can1 |
Can2 |
Can1 |
Can2 |
|||||||
|
AUB |
0.947 |
0.036 |
–0.671 |
0.593 |
–0.316 |
–0.732 |
||||||
|
BBH |
0.768 |
0.087 |
0.783 |
0.222 |
0.616 |
0.729 |
||||||
|
BNL |
0.881 |
0.423 |
0.700 |
0.086 |
0.849 |
0.464 |
||||||
|
BPL |
–0.723 |
0.608 |
0.300 |
0.242 |
||||||||
|
DKB |
–0.875 |
0.260 |
–0.507 |
0.672 |
–0.685 |
0.381 |
||||||
|
EKB |
–0.658 |
0.228 |
–0.097 |
0.160 |
||||||||
|
FOL |
0.237 |
0.266 |
0.887 |
0.226 |
0.744 |
0.153 |
||||||
|
FRC |
0.839 |
–0.202 |
0.868 |
–0.018 |
0.869 |
0.284 |
||||||
|
GOL |
0.763 |
0.556 |
0.935 |
–0.249 |
0.938 |
0.104 |
||||||
|
MDH |
0.700 |
0.468 |
0.611 |
0.770 |
0.765 |
0.080 |
||||||
|
NLB |
–0.971 |
–0.088 |
–0.764 |
0.332 |
||||||||
|
NLH |
0.895 |
0.202 |
0.500 |
–0.451 |
||||||||
|
OBB |
0.942 |
–0.067 |
0.389 |
0.369 |
0.764 |
–0.413 |
||||||
|
OBH |
0.156 |
0.093 |
0.229 |
–0.765 |
–0.385 |
–0.572 |
||||||
|
OCC |
0.938 |
–0.147 |
0.952 |
0.189 |
0.753 |
0.335 |
||||||
|
PAC |
0.006 |
0.910 |
0.738 |
–0.349 |
0.824 |
0.349 |
||||||
|
XCB |
0.661 |
–0.581 |
–0.908 |
0.357 |
0.313 |
–0.496 |
||||||
|
ZYB |
–0.269 |
0.001 |
–0.723 |
0.513 |
–0.766 |
0.147 |
||||||
TABLE 3—Mahalanobis distances (below diagonal) and Fst distances (above diagonal) for groups used in African analysis.
|
Af_Am |
Ash |
Cal |
Cam |
Dog |
Eu_Am |
GoC |
Togo |
|||||||||
|
Af_Am |
0.000 |
0.058 |
0.078 |
0.057 |
0.062 |
0.059 |
0.063 |
0.056 |
||||||||
|
Ash |
8.931 |
0.000 |
0.025 |
0.018 |
0.027 |
0.157 |
0.009 |
0.011 |
||||||||
|
Cal |
12.200 |
3.668 |
0.000 |
0.014 |
0.027 |
0.173 |
0.027 |
0.031 |
||||||||
|
Cam |
8.643 |
2.700 |
2.082 |
0.000 |
0.027 |
0.159 |
0.019 |
0.018 |
||||||||
|
Dog |
9.544 |
3.981 |
4.059 |
3.985 |
0.000 |
0.151 |
0.047 |
0.029 |
||||||||
|
Eu_Am |
9.102 |
26.727 |
30.075 |
27.285 |
25.522 |
0.000 |
0.175 |
0.155 |
||||||||
|
GoC |
9.682 |
1.381 |
4.019 |
2.836 |
7.176 |
30.635 |
0.000 |
0.022 |
||||||||
|
Togo |
8.481 |
1.605 |
4.572 |
2.676 |
4.344 |
26.325 |
3.304 |
0.000 |
The European American CV plot (Figure 3) highlights that European Americans, South Africans, and Portuguese are distanced from all other European Groups on the first axis. The Croatians and Czechs are more similar to one another as are the Germans and Italians. The second axis emphasizes the intermediate nature of the European Americans as compared to the South African and Portuguese groups (Table 5). The structure coefficients show that high scores on CV1 are associated with long cranial bases, high vaults, generally longer vaults and narrow vaults and faces (Table 2). High scores on CV2 reflect greater vault and face breadth, low orbits, and greater mastoid height.
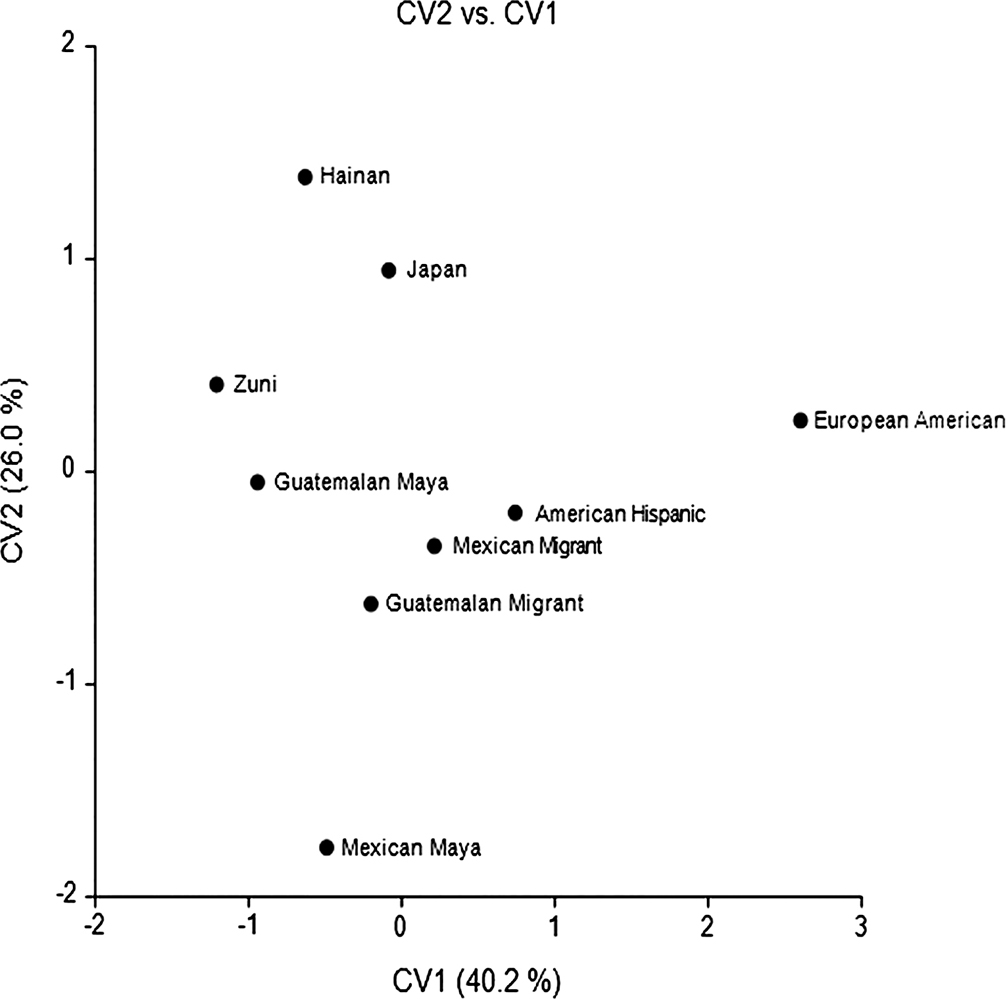
FIG. 2—Hispanic American CV Plot.
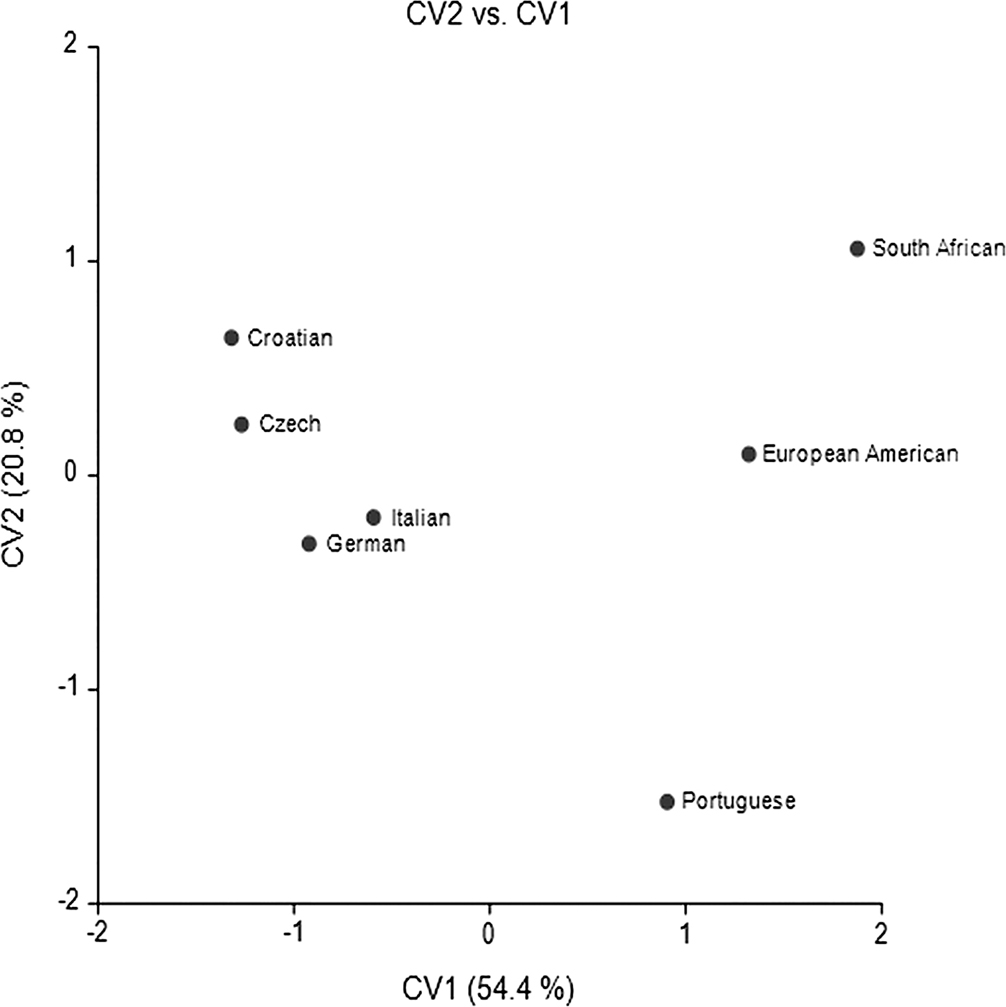
FIG. 3—European American CV Plot.
TABLE 4—Mahalanobis distances (below diagonal) and Fst distances (above diagonal) for groups used in Hispanic analysis.
|
Eu_Am |
Ghisp |
Hai |
Jap |
Hisp Am |
Mmaya |
UShisp |
Zuni |
Gmaya |
||||||||||
|
Eu_Am |
0.000 |
0.064 |
0.085 |
0.058 |
0.048 |
0.095 |
0.031 |
0.098 |
0.089 |
|||||||||
|
Ghisp |
9.801 |
0.000 |
0.046 |
0.032 |
0.007 |
0.035 |
0.020 |
0.029 |
0.019 |
|||||||||
|
Hai |
13.359 |
7.015 |
0.000 |
0.019 |
0.042 |
0.069 |
0.050 |
0.039 |
0.045 |
|||||||||
|
Jap |
8.847 |
4.713 |
2.734 |
0.000 |
0.026 |
0.058 |
0.025 |
0.031 |
0.027 |
|||||||||
|
Mhisp |
7.288 |
1.012 |
6.353 |
3.822 |
0.000 |
0.040 |
0.012 |
0.031 |
0.023 |
|||||||||
|
Mmaya |
15.034 |
5.210 |
10.597 |
8.862 |
5.964 |
0.000 |
0.046 |
0.061 |
0.051 |
|||||||||
|
UShisp |
4.577 |
2.891 |
7.584 |
3.637 |
1.695 |
7.022 |
0.000 |
0.036 |
0.025 |
|||||||||
|
Zuni |
15.585 |
4.324 |
5.821 |
4.623 |
4.626 |
9.340 |
5.443 |
0.000 |
0.018 |
|||||||||
|
Gmaya |
14.080 |
2.820 |
6.733 |
3.974 |
3.368 |
7.670 |
3.753 |
2.688 |
0.000 |
TABLE 5—Mahalanobis distances (below diagonal) and Fst distances (above diagonal) for groups used in European analysis.
|
Czech |
Eu_Am |
Ger |
Por |
Saf |
Ita |
Cro |
||||||||
|
Czech |
0.000 |
0.078 |
0.018 |
0.071 |
0.091 |
0.018 |
0.023 |
|||||||
|
Eu_Am |
9.464 |
0.000 |
0.066 |
0.042 |
0.040 |
0.044 |
0.071 |
|||||||
|
Ger |
2.066 |
7.956 |
0.000 |
0.052 |
0.086 |
0.015 |
0.032 |
|||||||
|
Por |
8.543 |
4.954 |
6.203 |
0.000 |
0.067 |
0.043 |
0.085 |
|||||||
|
Saf |
11.227 |
4.674 |
10.501 |
8.064 |
0.000 |
0.074 |
0.100 |
|||||||
|
Ita |
2.047 |
5.176 |
1.696 |
5.002 |
8.896 |
0.000 |
0.024 |
|||||||
|
Cro |
2.669 |
8.543 |
3.698 |
10.395 |
12.502 |
2.699 |
0.000 |
Discussion
Our results provide evidence of geographic structure in that American population groups are differentiated from their geographic, ancestral origin groups. Thus, these American groups represent local population groups and local variation found in the U.S.. These results are not surprising given the population histories of each group and the documented gene flow and secular changes that have taken place in the American population over the past 150+ years (Jantz 2001; Meadows Jantz & Jantz 1999; Spradley 2006; Wescott & Jantz 2005). It is possible that the dissimilarity of the American groups to their ancestral groups is due to a lack of directly comparable reference data, especially for the European Americans. However, the groups used in the present analysis represent groups that are documented or have reliable contextual information along with available craniometric data.
The American population groups used in the current analyses have ancestry in Africa, Europe, and Mexico, all of which have documented population structure. Structure has been documented within Africa using genetic and craniometric data and is thought to be influenced by ethnicity, language, and geography (Keita 1990; Spradley 2006; Stull 2013; Tishkoff et al. 2009), although genetic distance and geography have varied strengths (Tishkoff et al. 2009) likely due to the Bantu migration. Europe is also highly structured based on geography. Relethford et al. (1980) found variation among local populations in Ireland using anthropometric data, but also found that as migration increased, among group variation decreased. Further, Novembre et al. (2008) demonstrated that across Europe, an individual’s residence can be predicted geographically within a few hundred km based on SNP data. Mexico also demonstrates geographic structure on a clinal scale, with higher European admixture in the North and the least in the South and Peninsular regions with Central Mexico presenting intermediate (Algee-Hewitt et al. 2018; Hughes et al. 2013, 2017). The within group variation in Africa, Europe, and Mexico is not found within American population groups.
Using craniometric data and unsupervised clustering, Algee-Hewitt (2016) demonstrated that that the American population can be resolved into three basic clusters, African American, European Americans, and Native American/Hispanic. However, she found relatively little within group structure. Algee-Hewitt’s results are also in line with genetic studies. Micheletti et al. (2020) found that over 90% of African Americans have genes from four major regions of West Africa suggesting that any initial structure resulting from the African Diaspora has been lost. Although the degree of admixture is patterned with higher percentages of African ancestry in the southeastern U.S. (Baharian et al. 2016). Although European immigrants came from many geographic areas within Europe, genome wide SNP data found relatively little structure in European Americans, identifying only NW Europeans, SE Europeans, and Ashkenazi Jews (Price et al. 2008). While structure has been found in Hispanic Americans, with more Hispanics of Mexican origin in the West and Caribbean in the East (Bertoni et al. 2003), Algee-Hewitt (2016) did not find structure in her Hispanic sample, most likely because her sample was predominantly of Mexican origin. Our results indicate similarity Hispanic Americans and Mexican migrants; however, they are also differentiated. The Mexican migrants are less similar to the Mexican and Guatemalan Mayans as they are thought to exhibit more admixture (Spradley 2021), yet they are still differentiated from Hispanic Americans with Mexican ancestry.
Craniofacial secular change has been documented in historic to modern African and European Americans (Jantz 2001; Jantz & Jantz 2016; Jantz & Meadows Jantz 2000; Spradley 2006; Wescott & Jantz 2005) but less so in Hispanic Americans (Spradley et al. 2016). Studies focusing on African and European Americans find that both groups show changes in the same direction with a most notable increase in vault height, particularly in the cranial base (Wescott & Jantz 2005). Secular change can result from a variety of factors including gene flow, improvements in overall health conditions, and plasticity. Given that both African and European Americans have shared the same environment for over several hundred centuries, population structure is still apparent among these two groups. However, our analyses suggest that African Americans are more similar to European Americans than admixture proportions would predict, possibly due to the shared American environment. Although secular change has influenced the overall craniofacial morphology of American population groups, such changes do not obscure the underlying genetic structure (Relethford 2004). Therefore, secular change is not the sole driver of dissimilarity between American groups and ancestral groups.
Given the similarities between these two groups and their intermediate or dissimilar positions relative to their ancestral groups, an additional analysis, to highlight and contextualize our results within a forensic anthropological framework, was performed. A discriminant functional analysis (DFA) was performed to assess how well these American groups classify when compared to their ancestral groups. A cross-validated classification matrix is presented in Table 6. Only 29 African American misclassify into the African group, only 7 more than classify into the European American group. These results agree with the intermediate position of African American presented in our CV plot. Further, West Africans only misclassify into the African American group. A total of 61 European Americans classify into the European group and 20 as African American. Interestingly, Europeans misclassify into all other groups. Given that 75% of African Americans and 84% of European Americans are correctly classified into their own group, we suggest that the ability to predict group membership can be referred to as affinity.
TABLE 6—Classification Matrix
|
N |
Afr_Am |
Eur_Am |
European |
W. African |
% correct |
|||||||
|
Afr_Am |
270 |
202 |
22 |
17 |
29 |
74.8 |
||||||
|
Eur_Am |
509 |
20 |
427 |
61 |
1 |
83.8 |
||||||
|
European |
406 |
56 |
61 |
279 |
10 |
68.7 |
||||||
|
W. Africa |
242 |
27 |
0 |
0 |
215 |
88.8 |
Conclusions
Forensic anthropology has traditionally been a subdiscipline of skeletal biology. However, it should also be considered a subdiscipline of anthropological genetics. Brues (1992) understood population structure (and simulated it) before forensic anthropology crystallized as a discipline. Analyses of population structure through biodistance, including estimations made by forensic anthropologists, employ fundamentals of anthropological genetics and skeletal biology, and provide insights regarding mating structures, geography, and environment, and their impact on quantitative trait variation and local population structures. We suggest that the ability to predict group membership at the level of local variation rather than global variation can be referred to as affinity. All of which is to say that it is vitally important that forensic anthropologists understand the populations from which their cases are drawn.
Our three analyses suggest that when forensic anthropologists provide an estimation of group membership within the U.S., they are providing an estimation of population affinity rather than ancestry. The estimation of affinity is more specific than ancestry and considers local variation (e.g., Hispanic American, African American, European American). If we compare craniometric data from an unknown individual to African Americans, Hispanic Americans, European Americans, or other contemporary American groups, then we are estimating which group the unknown is most similar to, and therefore the estimation would be considered affinity. Is the suggested difference between ancestry and affinity trivial? On the surface, perhaps. However, Maier et al. (2021) recently pointed out confusion and inconsistencies with terminology in forensic literature concerning the terms ancestry and race and how they are perceived as interchangeable. They call for discussions of standardization to improve practice and public engagement. Affinity provides more flexible terminology that is dependent on the researcher to fully contextualize and describe the groups used in the analyses. Further, it is more flexible and can be used in areas where population structure exists but is influenced by geographic boundaries, isolation by distance, or cultural assortative mating practices rather than prescribed racial or ethnic variation.
References
Algee-Hewitt BF, Hughes CE, Anderson BE. Temporal, geographic and identification trends in craniometric estimates of ancestry for persons of Latin American origin. Forensic Anthropology 2018;1(1):4–17.
Algee-Hewitt BFB. Population inference from contemporary American craniometrics. American Journal of Physical Anthropology 2016;160(4):604–624.
Algee-Hewitt BFB, Goldberg A. Better together: Thinking anthropologically about genetics. American Journal of Physical Anthropology 2016;160(4):557–560.
Algee-Hewitt BF. Geographic substructure in craniometric estimates of admixture for contemporary American populations. American Journal of Physical Anthropology 2017;164(2):260–280.
Baharian S, Barakatt M, Gignoux CR, Shringarpure S, Errington J, Blot WJ, et al. The great migration and African-American genomic diversity. PLoS Genetics 2016;12(5):e1006059.
Bass WM, Trimble MK. Human Osteology: A Laboratory and Field Manual. Columbia: Missouri Archaeological Society; 2005.
Berg GE, Ta’ala SC. Biological Affinity in Forensic Identification of Human Skeletal Remains: Beyond Black and White. Boca Raton, FL: CRC Press; 2014.
Bertoni B, Budowle B, Sans M, Barton SA, Chakraborty R. Admixture in Hispanics: Distribution of ancestral population contributions in the Continental United States. Human Biology 2003;75(1):1–11.
Black S, Ferguson E. Forensic Anthropology: 2000 to 2010. Boca Raton, FL: CRC Press; 2011.
Brues AM. Forensic diagnosis of race—general race vs specific populations. Social Science & Medicine 1992;34(2):125–128.
Bryc K, Auton A, Nelson MR, Oksenberg JR, Hauser SL, Willia S, et al. Genome-wide patterns of population structure and admixture in West Africans and African Americans. Proceedings of the National Academy of Sciences 2010;107(2):786–791.
Bryc K, Durand EY, Macpherson JM, Reich D, Mountain JL. The genetic ancestry of african americans, latinos, and european Americans across the United States. The American Journal of Human Genetics 2015;96(1):37–53.
Byers SN. Introduction to Forensic Anthropology. London: Taylor & Francis; 2016.
Christensen AM, Passalacqua NV, Bartelink EJ. Forensic Anthropology: Current Methods and Practice. London: Academic Press; 2019.
Cintado A, Companioni O, Nazabal M, Camacho H, Ferrer A, Fernandez De Cossio ME, et al. Admixture estimates for the population of Havana City. Annals of Human Biology 2009;36(3):350–360.
Colman K. Towards Virtual Forensic Anthropology [PhD dissertation]. University of Amsterdam; 2019.
Crawford MH. The Origins of Native Americans: Evidence from Anthropological Genetics. Cambridge: Cambridge University Press; 2001.
Crawford MH. Anthropological Genetics: Theory, Methods and Applications. Cambridge: Cambridge University Press; 2007.
Dudzik B. Investigating Cranial Variation in Japanese Populations Using Geometric Morphometrics [PhD dissertation]. Knoxville: University of Tennessee; 2015.
Edgar HJH. Biohistorical approaches to “race” in the United States: Biological distances among African Americans, European Americans, and their ancestors. American Journal of Physical Anthropology 2009;139(1):58–67.
Gill G, Rhine S, eds. Skeletal Attribution of Race. Albuquerque: University of New Mexico Maxwell Museum of Anthropology; 1990.
Go MC, Jones AR, Algee-Hewitt BF, Dudzik B, Hughes CE. Classification trends among contemporary Filipino crania using Fordisc 3.1. Forensic Anthropology 2019;2(4):293–303.
Gross JM, Edgar HJ. Geographic and temporal diversity in dental morphology reflects a history of admixture, isolation, and drift in African Americans. American Journal of Physical Anthropology 2021;175(2):497–505.
Hanis CL, Hewett-Emmett D, Bertin TK, Schull WJ. Origins of US Hispanics: Implications for diabetes. Diabetes Care 1991;14(7):618–627.
Howells W. Data from: Howells Craniometric Data Set. https://web.utk.edu/~auerbach/HOWL.htm. 1973.
Howells W. Skull shapes and the map. Papers of the Peabody Museum of Archaeology and Ethnology Vol. 79. Harvard University, Cambridge; 1989.
Hughes CE, Tise ML, Trammell LH, Anderson BE. Cranial morphological variation among contemporary Mexicans: Regional trends, ancestral affinities, and genetic comparisons. American Journal Physical Anthropology 2013;151(4):506–517.
Hughes CE, Algee-Hewitt BF, Reineke R, Clausing E, Anderson BE. Temporal patterns of Mexican migrant genetic ancestry: Implications for identification. American Anthropologist 2017;119(2):193–208.
Hughes CE, Dudzik B, Algee-Hewitt BF, Jones A, Anderson BE. Understanding (mis)classification trends of Latin Americans in Fordisc 3.1: Incorporating cranial morphology, microgeographic origin, and admixture proportions for interpretation. Journal of Forensic Sciences 2019;64(2):353–366.
Huxley J. Evolution:. The Modern Synthesis. Cambridge: The MIT Press; 1942.
Jantz R, Meadows Jantz L. Limb bone allometry in modern Euro-Americans. American Journal of Physical Anthropology 2017;163(2):252–263.
Jantz RL, Meadows Jantz L. Secular change in craniofacial morphology. American Journal of Human Biology 2000;12(3):327–338.
Jantz RL. Cranial change in Americans: 1850–1975. Journal of Forensic Sciences 2001;46(4):784–787.
Jantz RL, Spradley MK. Cranial Morphometric Evidence for Early Holocene Relationships and Population Structure. In: Owsley DW, Jantz RL, eds. Kennewick Man: The Scientific Investigation of an Ancient American Skeleton. College Station: Texas A&M University Press; 2014:472–488.
Jantz RL, Meadows Jantz L. The remarkable change in Euro-American cranial shape and size. Human Biology 2016;88(1):56–64.
Keita SOY. Studies of ancient crania from northern Africa. American Journal of Physical Anthropology 1990;83(1):35–48.
Klepinger LL. Fundamentals of forensic anthropology. vol 1. John Wiley & Sons; 2006.
L’Abbé EN, Kenyhercz M, Stull KE, Keough N, Nawrocki S. Application of Fordisc 3.0 to explore differences among crania of North American and South African Blacks and Whites. Journal of Forensic Sciences 2013;58(6):1579–1583.
Livingston F. Anthropological implications of sickle cell gene distribution in West Africa. American Anthropologist 1958;60(3):533–562.
Maier C, Craig A, Adams DM. Language use in ancestry research and estimation. Journal of Forensic Sciences 2021;66(1):11–24.
Manthey L, Jantz RL, Bohnert M, Jellinghaus KJ. Secular change of sexually dimorphic cranial variables in Euro-Americans and Germans. International Journal of Legal Medicine 2017;131(4):1113–1118.
Manthey L, Jantz RL, Vitale A, Cattaneo C. Population specific data improves Fordisc®’s performance in Italians. Forensic Science International 2018;292:263.e1–263.e7.
Meadows Jantz L, Jantz RL. Secular change in long bone length and proportion in the United States,1800–1970. American Journal of Physical Anthropology 1999;110:57–67.
Micheletti SJ, Bryc K, Esselmann SGA, Freyman WA, Moreno ME, Poznik GD, et al. Genetic consequences of the transatlantic slave trade in the Americas. American Journal of Human Genetics 2020;107(2):265–277.
Noe-Bustamante L. Key facts about US Hispanics and their diverse heritage. Pew Research Center. https://www.pewresearch.org/fact-tank/2019/09/16/key-facts-about-u-s-hispanics/. Created September 16, 2019. Accessed March 28, 2021.
Novembre J, Johnson T, Bryc K, Kutalik Z, Boyko AR, Auton A, et al. Genes mirror geography within Europe. Nature 2008;456(7218):98–101.
Ousley S, Jantz R, Freid D. Understanding race and human variation: Why forensic anthropologists are good at identifying race. American Journal of Physical Anthropology 2009;139(1):68–76.
Pilloud MA, Hefner JT. Biological Distance Analysis: Forensic and Bioarchaeological Perspectives. London: Academic Press; 2016.
Price AL, Butler J, Patterson N, Capelli C, Pascali VL, Scarnicci F, et al. Discerning the ancestry of European Americans in genetic associations studies. PLoS Genetics 2008;4(1):e26.
Reich D, Patterson N, Campbell D, Tandon A, Mazieres S, Ray, N, et al. Reconstructing native American population history. Nature 2012;488(7411):370–374.
Relethford J, Lees FC, Crawford MH. Population structure and anthropometric variation in rural western Ireland: Migration and biological differentiation. Annals of Human Biology 1980;7(5):411–428.
Relethford J. Boas and beyond: Migration and craniometric variation. American Journal of Human Biology 2004;16(4):379–386.
Relethford JH, Lees FC. The use of quantitative traits in the study of human population structure. American Journal of Physical Anthropology 1982;25(S3):113–132.
Relethford JH. Race and global patterns of phenotypic variation. American Journal of Physical Anthropology 2009;139(1):16–22.
Ross A, Slice D, Ubelaker D, Falsetti A. Population affinities of 19th century Cuban crania: implications for identification criteria in south Floridian Cuban Americans. Journal of Forensic Sciences 2004;49(1):1–6.
Ross AH, Ubelaker DH, Kimmerle EH. Implications of dimorphism, population variation, and secular change in estimating population affinity in the Iberian Peninsula. Forensic Science International 2011;206(1–3):214.e1–214.e5.
Rubi-Castellanos R, Martínez-Cortés G, Francisco Muñoz-Valle J, González-Martín A, Cerda-Flores RM, Anaya-Palafox M, et al. Pre-Hispanic Mesoamerican demography approximates the present-day ancestry of Mestizos throughout the territory of Mexico. American Journal of Physical Anthropology 2009;139(3):284–294.
Ruiz-Linares A, Adhikari K, Acuña-Alonzo V, Quinto-Sanchez M, Jaramillo C, Arias W, et al. Admixture in Latin America: geographic structure, phenotypic diversity and self-perception of ancestry based on 7,342 individuals. PLoS Genetics 2014;10(9):e1004572.
Smith J. W.E.B. Dubois, Felix von Luschan, and racial reform at the Fin de Siecle. Amerikastudien 2002;47:23–38.
Smith JD. WEB Du Bois, Felix von Luschan, and racial reform at the fin de siècle. Amerikastudien/American Studies 2002:23–38.
Spradley K, Stull KE, Hefner JT. Craniofacial secular change in recent Mexican migrants. Human Biology 2016;88(1):15–29.
Spradley M. Biological Anthropological Aspects of the African Diaspora: Geographic Origins, Secular Trends, and Plastic Versus Genetic Influences Utilizing Craniometric Data [PhD dissertation. Knoxville: The University of Tennessee; 2006.
Spradley MK, Jantz RL, Robinson A, Peccerelli F. Demographic change and forensic identification: Problems in metric identification of Hispanic skeletons. Journal of Forensic Sciences 2008;53(1):21–28.
Spradley MK. Data from: Mexican, Guatemalan, and Migrant Craniometric Dataset. http://doi.org/10.5281/zenodo.4011199. Created September 1, 2020.
Spradley MK. Use of craniometric data to facilitate migrant identifications at the United States/Mexico border. American Journal of Physical Anthropology 2021;175(2):486–496.
Stull KE. South African Long Bone Database. https://zenodo.org/record/3950301#.YbO91mDMLIW. Created July 17, 2020.
Stull KE. An Osteometric Evaluation of Age and Sex Differences in the Long Bones of South African Children from the Western Cape [PhD dissertation]. University of Pretoria; 2013.
Tise ML, Kimmerle EH, Spradley MK. Craniometric variation of diverse populations in Florida: Identification challenges within a border state. Annals of Anthropological Practice 2014;38(1):111–123.
Tishkoff SA, Reed FA, Friedlaender FR, Ehret C, Ranciaro A, Froment A, et al. The genetic structure and history of Africans and African Americans. Science 2009;324(5930):1035–1044.
Washburn SL. Section of anthropology: The new physical anthropology. Transactions of the New York Academy of Sciences 1951;13(7 Series II):298–304.
Weisensee KE, Jantz RL. Secular changes in craniofacial morphology of the Portuguese using geometric morphometrics. American Journal of Physical Anthropology 2011;145(4):548–559.
Wescott DJ, Jantz RL. Assessing craniofacial secular change in American blacks and whites using geometric morphometry. Modern Morphometrics in Physical Anthropology. Springer; 2005:231–245.
Williams FL, Belcher RL, Armelagos GJ. Forensic misclassification of ancient Nubian crania: Implications for assumptions about human variation. Current Anthropology 2005;46(2):340–346.
1. The term Hispanic is used over Latinx for several reasons. According to the Pew Research Center Hispanic Trends, approximately 76% of individuals living in the U.S. with geographic origins/ancestral ties to Latin America have not heard of the term Latinx and only 3% use it (Noe-Bustamante et al. 2020). Additionally, at this time, it is the most common term utilized for reporting missing and unidentified persons.
aDepartment of Anthropology, Texas State University, San Marcos, TX 78666, USA
bDepartment of Anthropology, University of Tennessee, Knoxville, TN 37996, USA
*Correspondence to: Kate Spradley, Department of Anthropology, Texas State University, 601 University Dr., San Marcos, TX 78666
E-mail: mks@txstate.edu
Received 06 April 2021; Revised 16 June 2021; Accepted 02 July 2021