Forensic Anthropology Vol. 5, No. 3: 239–250
RESEARCH ARTICLE
Craniometric Variation in a Regional Sample from Antioquia, Medellín, Colombia: Implications for Forensic Work in the Americas
Kelly R. Kamnikara* ● Joseph T. Hefnera ● Timisay Monsalveb ● Liliana Maria Bernal Florezb
ABSTRACT: Population affinity estimation is frequently assessed from measurements of the cranium. Traditional models place individuals into discrete groups―such as Hispanic―that often encompass very diverse populations. Current research, including this study, challenges these assumptions using more refined population affinity estimation analyses. We examine craniometric data for a sample of individuals from different regions in Antioquia, Colombia. We first assessed the sample to understand intraregional variation in cranial shape as a function of birthplace or a culturally constructed social group label. Then, pooling the Colombian data, we compare cranial variation with global contemporary and prehistoric groups. Results did not indicate significant intraregional variation in Antioquia; classification models performed poorly (28.6% for birthplace and 36.6% for social group). When compared to other groups (American Black, American White, Asian, modern Hispanic, and prehistoric Native American), our model correctly classified 75.5% of the samples. We further refined the model by separating the pooled Hispanic sample into Mexican and Guatemalan samples, which produced a correct classification rate of 74.4%. These results indicate significant differences in cranial form among groups commonly united under the classification “Hispanic” and bolster the addition of a refined approach to population affinity estimation using craniometric data.
KEYWORDS: forensic anthropology, craniometric analysis, population affinity estimation, human rights, biological distance
Population variation can be explored using metric analysis of the human cranium (Algee-Hewitt 2016; Hefner et al. 2016; Howells 1973; Relethford 1994; 2010; Roseman & Weaver 2004; Wrobel et al. 2018). In forensic anthropology, these analyses are incorporated in the estimation of ancestry, or broad geographical origin (Algee-Hewitt 2017; Dunn et al. 2020; Hefner et al. 2016; Spradley 2014a; Stull et al. 2014). These studies rely on known data obtained from reference samples to create population affinity estimation models generating probabilistic statements for an unknown individual’s population affinity. The level of resolution in these models can range from broad to narrow, generally representing some form similar to the three- or five-group ancestry, social constructs and peer-perceived classifications, or even finer population levels (Hefner 2018). Applying these models expedites the identification process in forensic casework and increases our understanding of group similarity within localized geographical arenas or larger geopolitical boundaries. Using these data, we investigate intraregional variation in a sample from Antioquia, Medellín, Colombia.
Colombians account for approximately 2%, or roughly 1.1 million, documented immigrants to the U.S. each year (López 2015). In 2015, the U.S. was the second most common destination for out-migration from Colombia (Carvajal 2017). Following current U.S. governmental classifications, Colombians are included in the broad demographic category Hispanic. This paper reinforces the argument for population-specific methods beyond Hispanic and emphasizes the need for representative comparative datasets. We agree with Ross et al. (2004) and Spradley (2014a, 2014b) that the term Hispanic is uninformative to the assessment of geographic origin in a forensic context. We present support for finer levels of resolution in population affinity estimation, specifically for Hispanic groups. When we do use the term Hispanic in this paper, we apply it as it is used in the United States’ governmental classifications to distinguish persons originating from Latin America. We understand this term is not reflective of self-identification or ethnicity.
Materials and Methods
Data used in this study include craniometric measurements collected from skeletal material originating in Antioquia, Medellín, Colombia; a sample from the Forensic Databank (FDB; Jantz & Moore-Jansen 1998); and a sample of prehistoric Native American data from the Howells dataset (1973) and the National Museum of Natural History (JTH). A separate discussion for each sample follows.
Colombian Sample
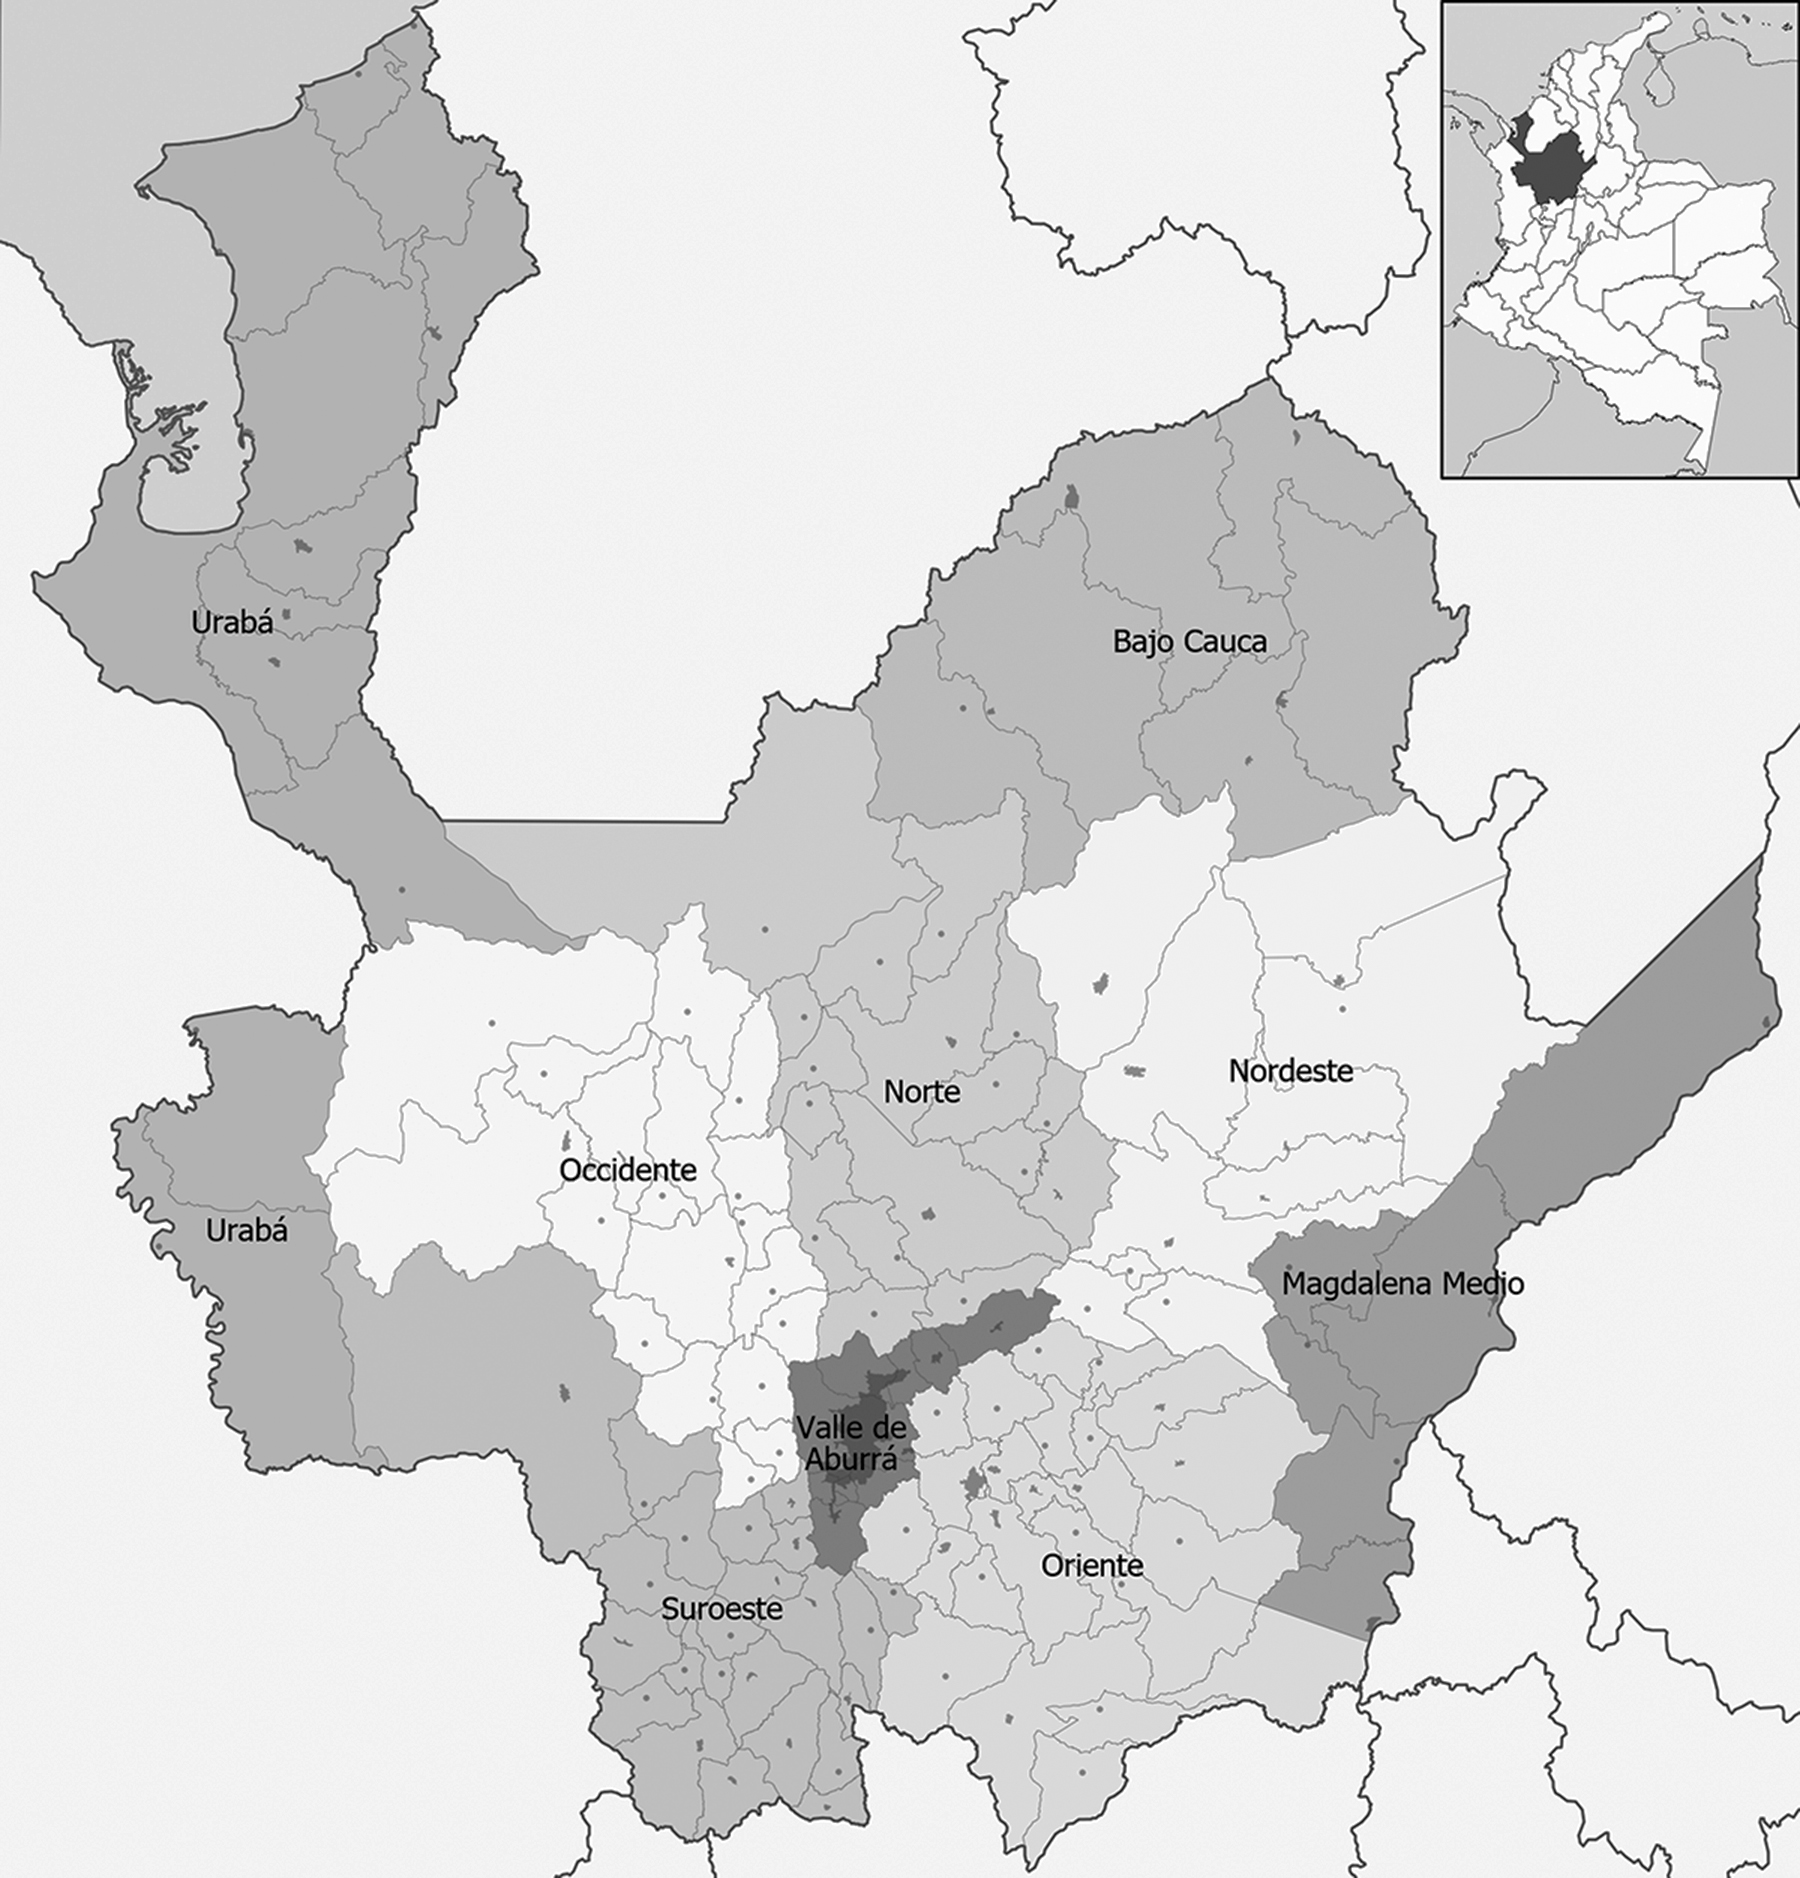
The craniometric data in the Colombian sample comprises 19 interlandmark distance measures (Table 1) from 243 individuals (males = 172; females = 70; unknown = 1). This sample—referred to hereafter as the Colombian sample―originates from the osteological reference collection (N = 317) housed at the University of Antioquia, Medellín, Colombia (Monsalve & Hefner 2016). This collection contains individuals with known birth years between the 1950s and the current century, with age-at-death values ranging from birth to 99 years. Many of the individuals in the Colombian sample originate from the San Pedro Cemetery Museum and the University Cemetery in the city of Medellín, but have birth locations from multiple municipalities within the department of Antioquia (Table 2; Figure 1). To ensure ethical use of data, we only included those individuals who donated their remains or were donated responsibly by next of kin for skeletal research. Information on phylogeographical social classifications were included in our analysis, although the nature of self-assignment or assignment after death is not known (see Table 2). As social group is used to distinguish living peoples in Colombia, we also test the classificatory power of those labels derived from the osteological collection. Monsalve and Hefner (2016) provide a discussion on the roles social groupings play in Antioquia. Lastly, we pooled the Colombian sample for comparison to other groups from the FDB, the Howells data, and the NMNH.
TABLE 1—Interlandmark distances used in analysis.
|
Abbreviation |
Measurement |
Abbreviation |
Measurement |
|||
|
GOL XCB ZYB BBH BNL BPL MAB AUB NLH NLB WFB* FOB* |
cranial length cranial breadth bizygomatic breadth basion-bregma height cranial base length basion-prosthion length maxilla-alveolar breadth biauricular breadth nasal height nasal breadth minimum frontal breadth foramen magnum breadth |
OBB OBH EKB DKB FRC PAC OCC FOL MDH MAL* UFBR* UFHT* |
orbital breadth orbit height biorbital breadth interorbital breadth frontal chord parietal chord occipital chord foramen magnum length mastoid height maximum alveolar length upper facial breadth upper facial height |
Adapted from Langley et al. (2016). (*) indicates a measurement used in the intraregional Colombian analysis.
Comparative Samples
A subset of individuals from the FDB (n = 654), the Howells dataset (n = 268), and the NMNH (n = 60) were compared to the Colombian sample (see Table 3). The FDB is a repository for cranial and postcranial measurements from identified skeletal remains (Moore-Jansen & Jantz 1998). Our analysis includes samples representing American Black, American White, Asian, and individuals identified as Hispanic in the FDB. These samples were selected to reflect the current demographic structure of the U.S. Data for the American Black, American White, and Asian samples in the FDB include samples from the Terry, Bass, and Hamman-Todd Skeletal Collections and identified casework submitted to the FDB by forensic practitioners across the U.S. The FDB Hispanic sample broadly reflects Hispanic individuals as defined by U.S. practices, and includes individual with origins from a number of countries (e.g., Costa Rica, El Salvador, Guatemala, Honduras, Mexico, Puerto Rico, and Panamá) (Jantz & Ousley 2005). Due to small sample sizes (n < 2) for some countries in the FDB Hispanic sample, we limited our samples to the Mexican and Guatemalan individuals. We also compiled a third comparative sample representing prehistoric Native Americans derived from the Howells dataset and the NMNH. This sample was included to attempt to reflect groups with similar population histories to indigenous populations in the Americas.
TABLE 2—Colombian sample by birthplace and social group.
|
Birthplace |
Social Group |
n |
||
|
Uraba |
A |
6 |
||
|
Occidente |
A |
17 |
||
|
Oriente |
B |
29 |
||
|
Suroeste |
B |
44 |
||
|
Nordeste |
C |
6 |
||
|
Norte |
D |
25 |
||
|
Valle de Aburra |
E |
89 |
||
|
Total: |
216 |
*Adapted from Monsalve & Hefner (2016).
Statistical Analyses
All analyses were conducted using R Statistical Software (R Core Team 2018), a free software environment for statistical computing and graphics. To remove the influence of sex on the data, all observations were first scaled and centered (setting mean to 0 and standard deviation to 1). For the majority of the sample, complete observation was the norm. However, some of the samples did have missing data. This includes (percent missing): Asian (9%), Colombian (33%), and prehistoric Native American (8%). Individuals with ten or more missing ILDs were removed entirely from the analysis. Missing values were imputed, by variable, using the mice package (van Buuren & Groothuis-Oudshoorn 2011). This method is appropriate for imputation of several data types, including continuous data. We used the predictive mean matching approach to select a random observation from the pool of observed values (by variable) to replace a missing value (van Buuren & Groothuis-Oudshoorn 2011).
FIG. 1—Map of Antioquia, Colombia (Monsalve & Hefner 2016).
Outliers were identified using Cook’s distance. Birthplace and social group were tested among the intraregional sample for associations with craniometric measurements using a multivariate analysis of variance (MANOVA) and pairwise analysis of variance (ANOVA). The MANOVA was used to examine the effect of social group and birthplace on cranial morphology, while the pairwise ANOVAs examined the individual relationships between the ILDs and the grouping variables.
A canonical (linear discriminant function [LDFA]) analysis quantified the relationship between samples and measured variability within and between each to develop prediction equations. For intraregional tests, the dependent variables were birthplace and social group. In the more comprehensive comparative analysis, geographic origin was the dependent variable. In both LDFAs, prior probabilities were set to simulate equal probability of group membership. One analysis explored classification accuracies for the American Black, American White, Asian, pooled Colombian, prehistoric Native American, and pooled Hispanic samples; a second analysis separated the Hispanic sample into Colombian, Guatemalan, and Mexican groups. All models were cross-validated using a leave-one-out (LOOCV) procedure. Finally, we calculated Mahalanobis distances (D2) using the HDMD package (McFerrin 2013) to assess similarity/dissimilarity and explore potential group relatedness.
TABLE 3—Sample distribution.
|
Sample |
Size |
|||||||||||
|
males |
females |
unknown |
total |
|||||||||
|
Colombian |
172 |
70 |
1 |
243 |
||||||||
|
American White |
126 |
74 |
200 |
|||||||||
|
American Black |
101 |
99 |
200 |
|||||||||
|
Asian |
151 |
8 |
1 |
160 |
||||||||
|
Native American |
146 |
175 |
7 |
328 |
||||||||
|
Arikara |
42 |
27 |
69 |
― |
||||||||
|
Santa Cruz |
51 |
51 |
102 |
― |
||||||||
|
Blackfeet |
25 |
45 |
70 |
― |
||||||||
|
Indian Knoll |
11 |
16 |
27 |
― |
||||||||
|
Smithsonian (JTH) |
17 |
36 |
7 |
60 |
― |
|||||||
|
Hispanic |
94 |
|||||||||||
|
Mexican |
74 |
9 |
83 |
― |
||||||||
|
Guatemalan |
6 |
5 |
11 |
― |
||||||||
|
Total: |
1,198 |
|||||||||||
*The subset of individuals in the American Black, American White, and Asian groups were randomly selected using the rand() function in Excel.
Results
Intraregional Variability within Antioquia
Cook’s distance identified six potential outliers; however, four were from the Uraba (n = 6) region and one from the Nordeste (n = 6) region. Due to these already small samples, the outliers were not removed.
The MANOVA results indicate significant effects (α = 0.05) for both birthplace and social group. The pairwise ANOVAs identified significant interaction between (1) birthplace and BBH, BNL, BPL, MAB, and NLH, and (2) social group and BBH, BPL, MAB, and NLH.
The LDFA tested the influence of birthplace on cranial variability. Figure 2 illustrates the group centroids and their relationships. The overall correct classification rate by birthplace using LOOCV was 28.6%; an accuracy above random allocation (~14%). Correct classifications range from 16.7% (Nordeste, Uraba) to 37.1% (Valle de Aburra) (Table 4). Here, the regions with the highest accuracies were Valle de Aburra followed by Occidente (28.6%) and Norte (28.0%). Uraba and Nordeste had the lowest classification accuracy at 16.7%, just above random, which could indicate disparate populations or issues related to sample size (n = 6) for both groups (Figure 2).
To understand if social designations influence craniometric variability (i.e., gene flow), a second LDFA was performed using social group categories. Performance rates were not high, although group classification increased to 36.6%. The highest classification accuracy was 43.8% (Table 5). Figure 3 shows the centroids for each social group.
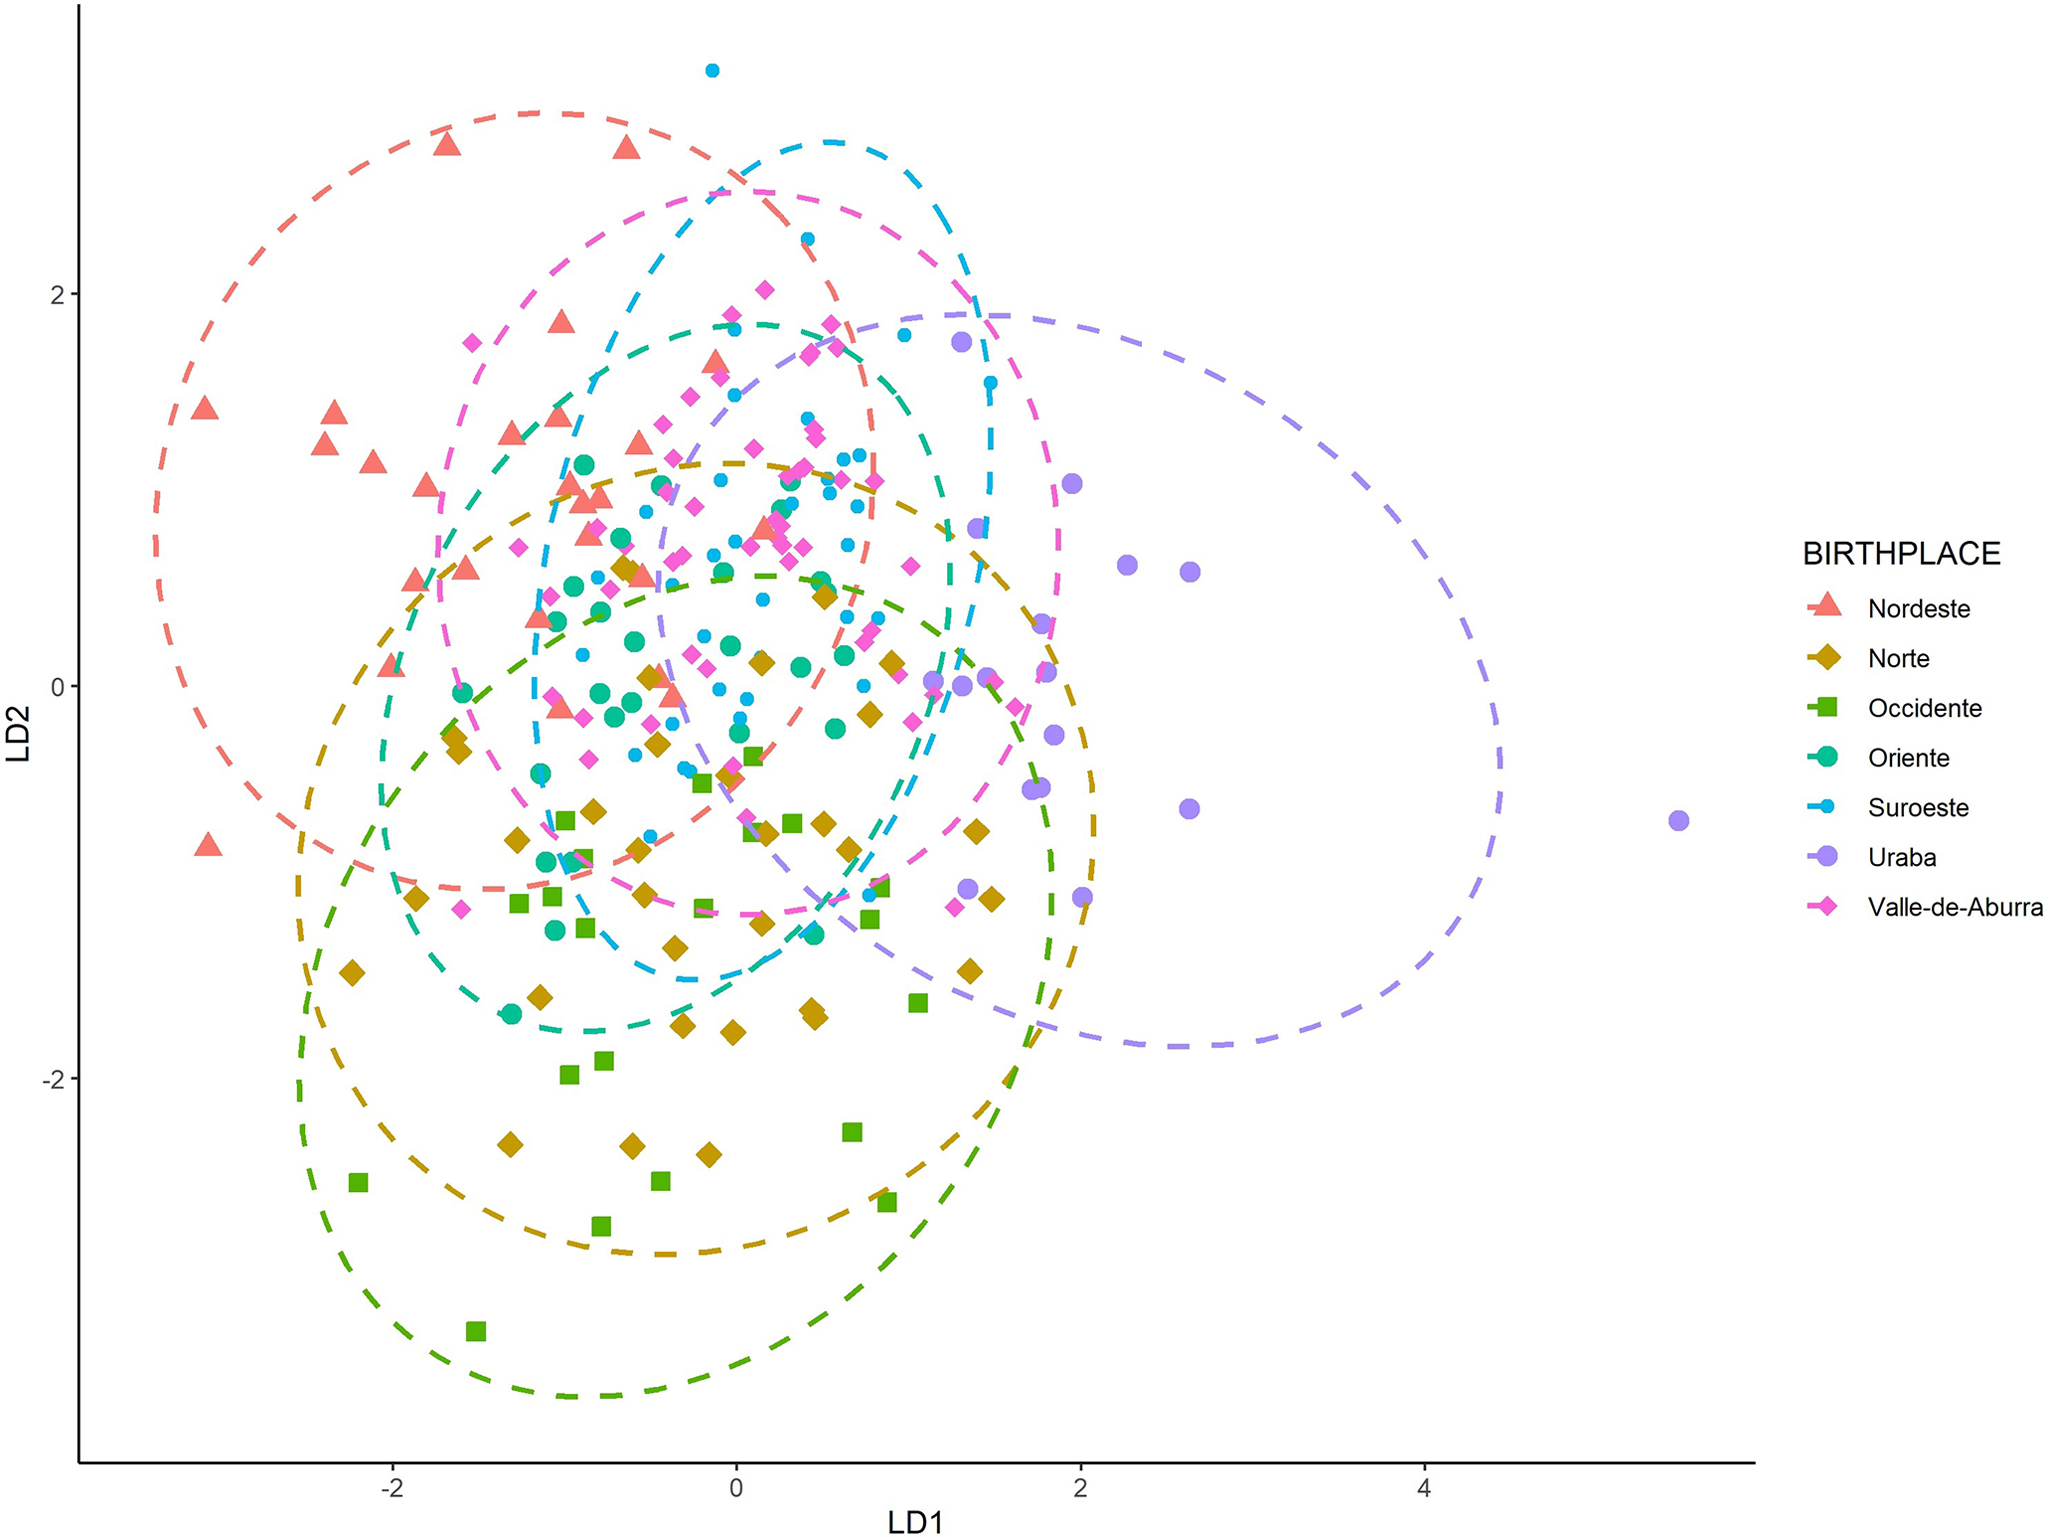
FIG. 2—The first two discriminant axes, by birthplace.
In order to understand overall similarity, a Mahalanobis distance (D2) matrix was calculated using birthplace and social group (Tables 6 and 7). Here, Suroeste and Oriente are similar, while the rest of the groups appear as separate branches. Uraba is most unlike other groups (Figure 4). Social groups ‘A’ and ‘D’ are most similar to each other, as are ‘B’ and ‘E’; however, social group ‘C’ is distinct from all other groups (Figure 5).
Variability among the Colombian Sample and Comparative Samples
The LDFA of the Colombian and the comparative samples perform well (Figure 6). The American Black, American White, and Colombian sample exhibit slight overlap, but overall good separation. There is significant overlap between the Hispanic, prehistoric Native American, and Asian samples. Table 8 provides the classification accuracies for each group, with an overall model accuracy of 74.7%. The lowest classification rate is for the combined Hispanic group (50.0%), while all other groups had classification accuracies higher than 71.0%.
An additional LDFA on the refined Hispanic dataset has a similar overall classification rate (71.4%). Figure 7 illustrates the separation of the LDFA on the test sample. However, group classification rates vary considerably (Table 9). The Colombian sample classifies moderately well (84.7%) with eight individuals misclassifying as Mexican and two individuals misclassifying as Guatemalan, the two other Hispanic reference samples (Table 9).
TABLE 4—Classification rate of Colombian sample by birthplace (LOOCV).
|
Nordeste |
Norte |
Occidente |
Oriente |
Suroeste |
Uraba |
Valle de Aburra |
CCR (%) |
|||||||||
|
Nordeste |
1 |
0 |
0 |
2 |
2 |
0 |
1 |
16.7 |
||||||||
|
Norte |
3 |
7 |
6 |
3 |
2 |
1 |
3 |
28.0 |
||||||||
|
Occidente |
0 |
2 |
4 |
4 |
2 |
1 |
3 |
28.6 |
||||||||
|
Oriente |
5 |
5 |
2 |
6 |
7 |
2 |
2 |
20.7 |
||||||||
|
Suroeste |
6 |
7 |
1 |
7 |
9 |
6 |
8 |
20.5 |
||||||||
|
Uraba |
0 |
1 |
0 |
1 |
2 |
1 |
1 |
16.7 |
||||||||
|
Valle de Aburra |
10 |
13 |
7 |
8 |
12 |
6 |
33 |
37.1 |
||||||||
|
Overall |
28.6 |
TABLE 5—Classification rate of the Colombian sample by social group (LOOCV).
|
Group A |
Group B |
Group C |
Group D |
Group E |
CCR (%) |
|||||||
|
Group A |
5 |
5 |
1 |
5 |
4 |
25.0 |
||||||
|
Group B |
11 |
23 |
13 |
14 |
12 |
31.5 |
||||||
|
Group C |
0 |
4 |
1 |
0 |
1 |
16.7 |
||||||
|
Group D |
6 |
3 |
3 |
10 |
3 |
40.0 |
||||||
|
Group E |
11 |
14 |
10 |
15 |
39 |
43.8 |
||||||
|
Overall |
36.6 |
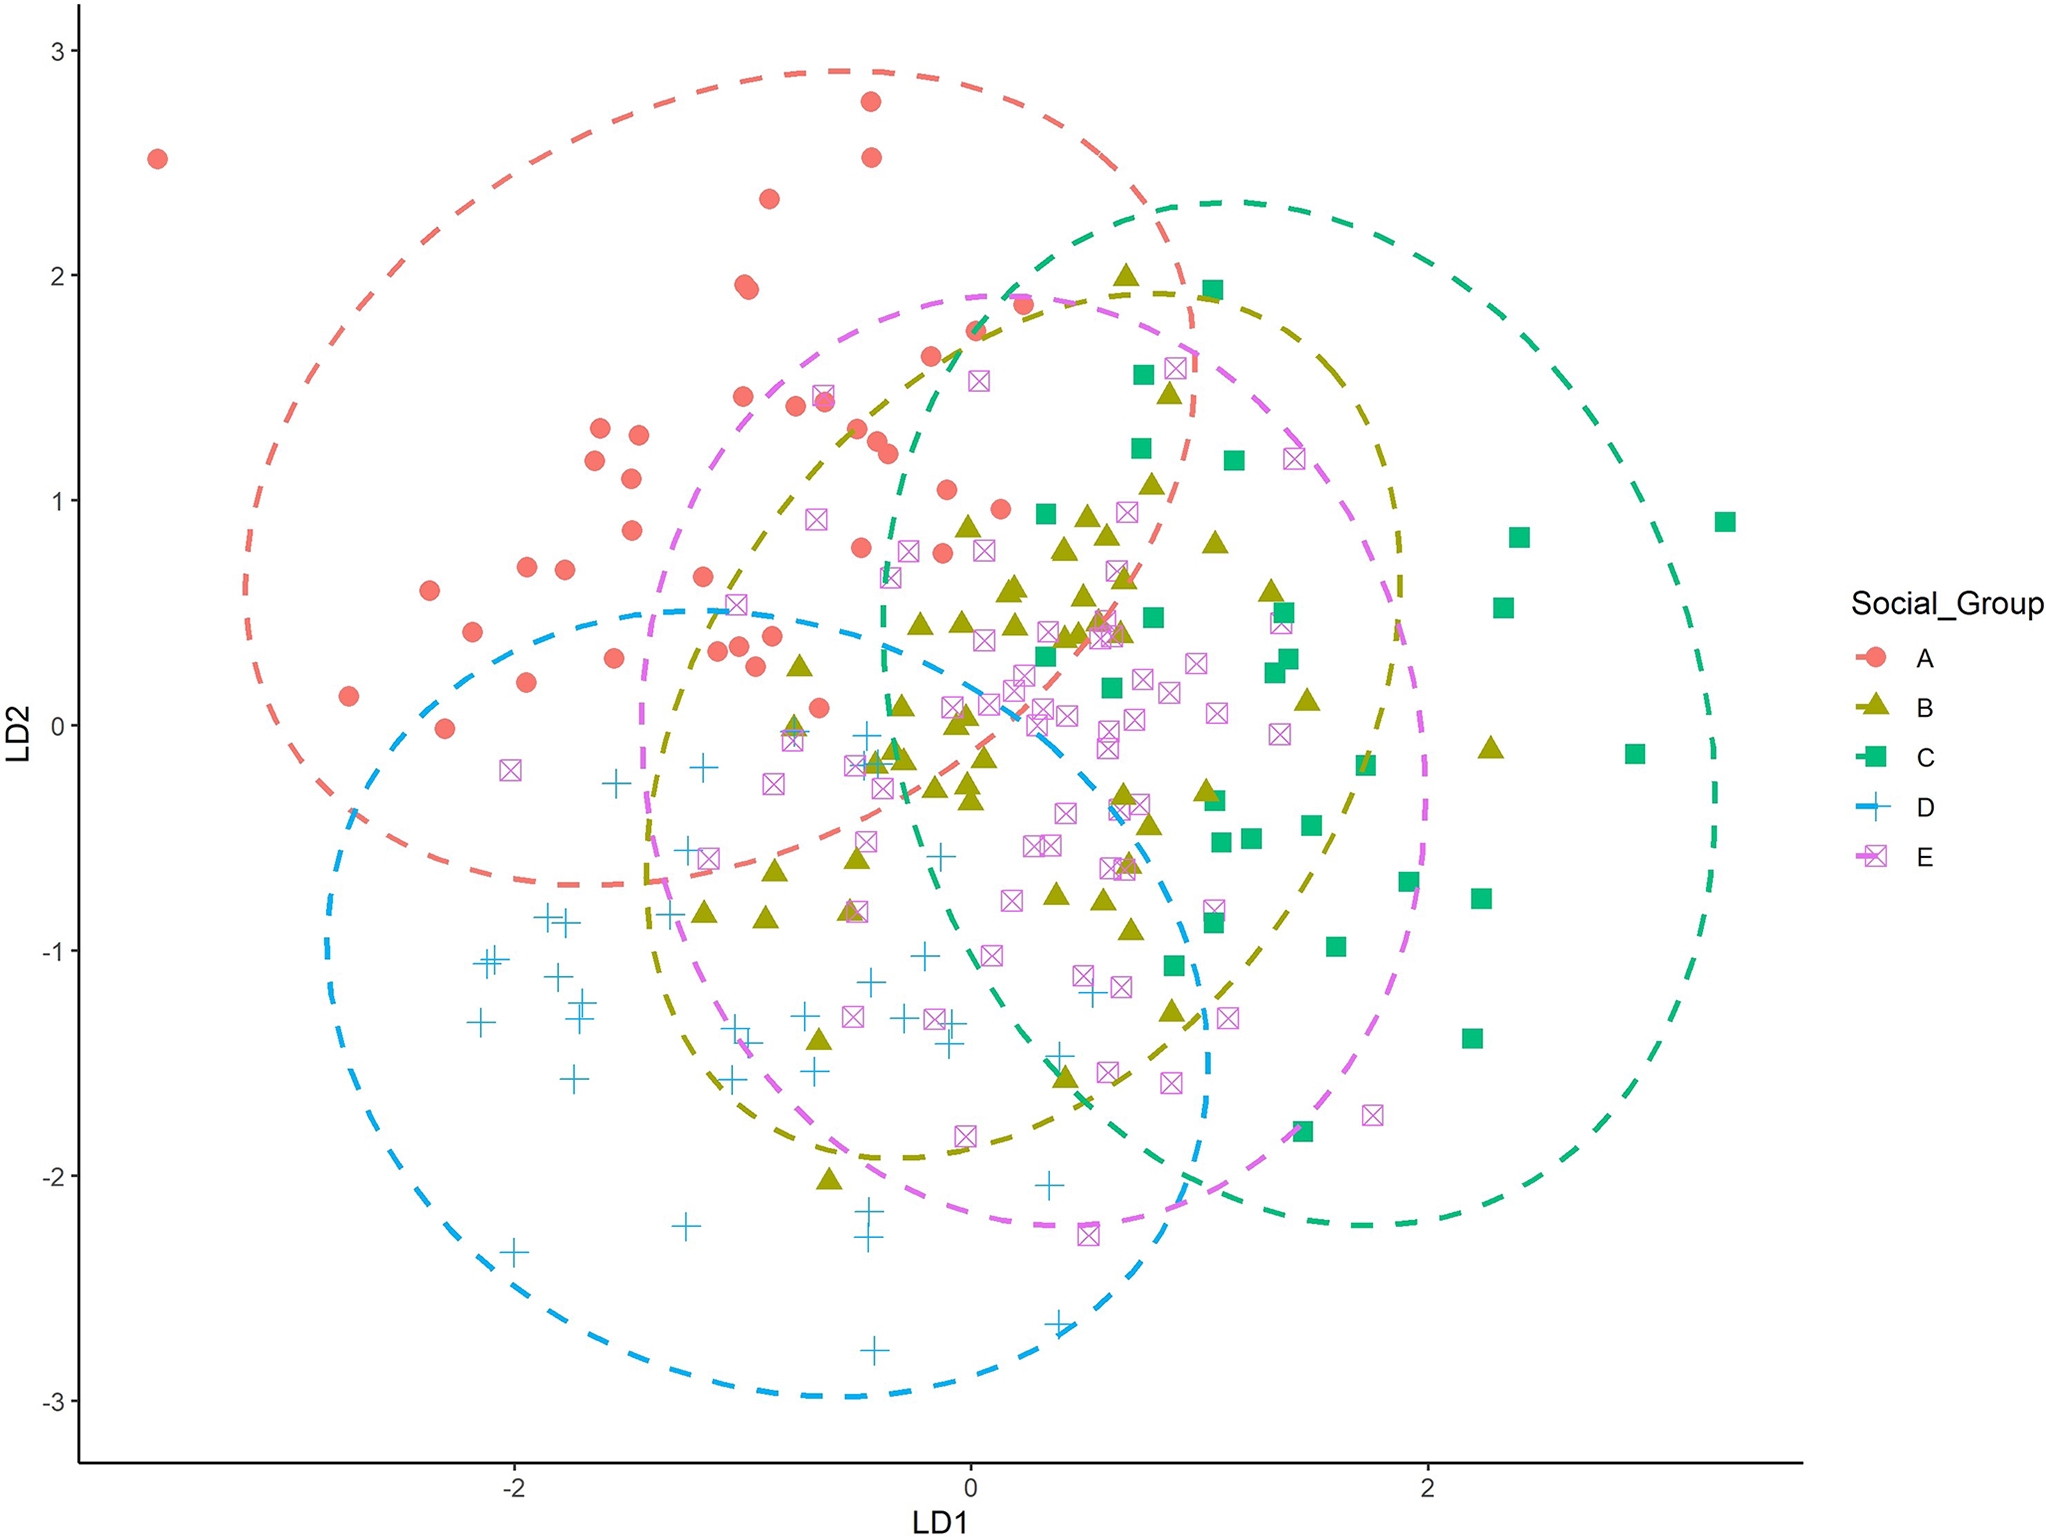
FIG. 3—The first two discriminant axes, by social group.
TABLE 6—Mahalanobis distance (D2) matrix on birthplace.
|
Nordeste |
Norte |
Occidente |
Oriente |
Suroeste |
Uraba |
|||||||
|
Nordeste |
— |
|||||||||||
|
Norte |
12.41 |
— |
||||||||||
|
Occidente |
12.67 |
6.39 |
— |
|||||||||
|
Oriente |
9.61 |
8.21 |
9.21 |
— |
||||||||
|
Suroeste |
10.96 |
8.99 |
9.54 |
7.52 |
— |
|||||||
|
Uraba |
19.70 |
14.32 |
13.32 |
14.52 |
10.94 |
— |
||||||
|
Valle de Aburra |
11.18 |
10.07 |
10.52 |
9.81 |
7.02 |
12.30 |
TABLE 7—Mahalanobis distance (D2) matrix on social group.
|
A |
B |
C |
D |
|||||
|
A |
— |
|||||||
|
B |
7.62 |
— |
||||||
|
C |
13.84 |
9.78 |
— |
|||||
|
D |
7.27 |
7.87 |
12.41 |
— |
||||
|
E |
9.26 |
7.37 |
11.18 |
10.07 |
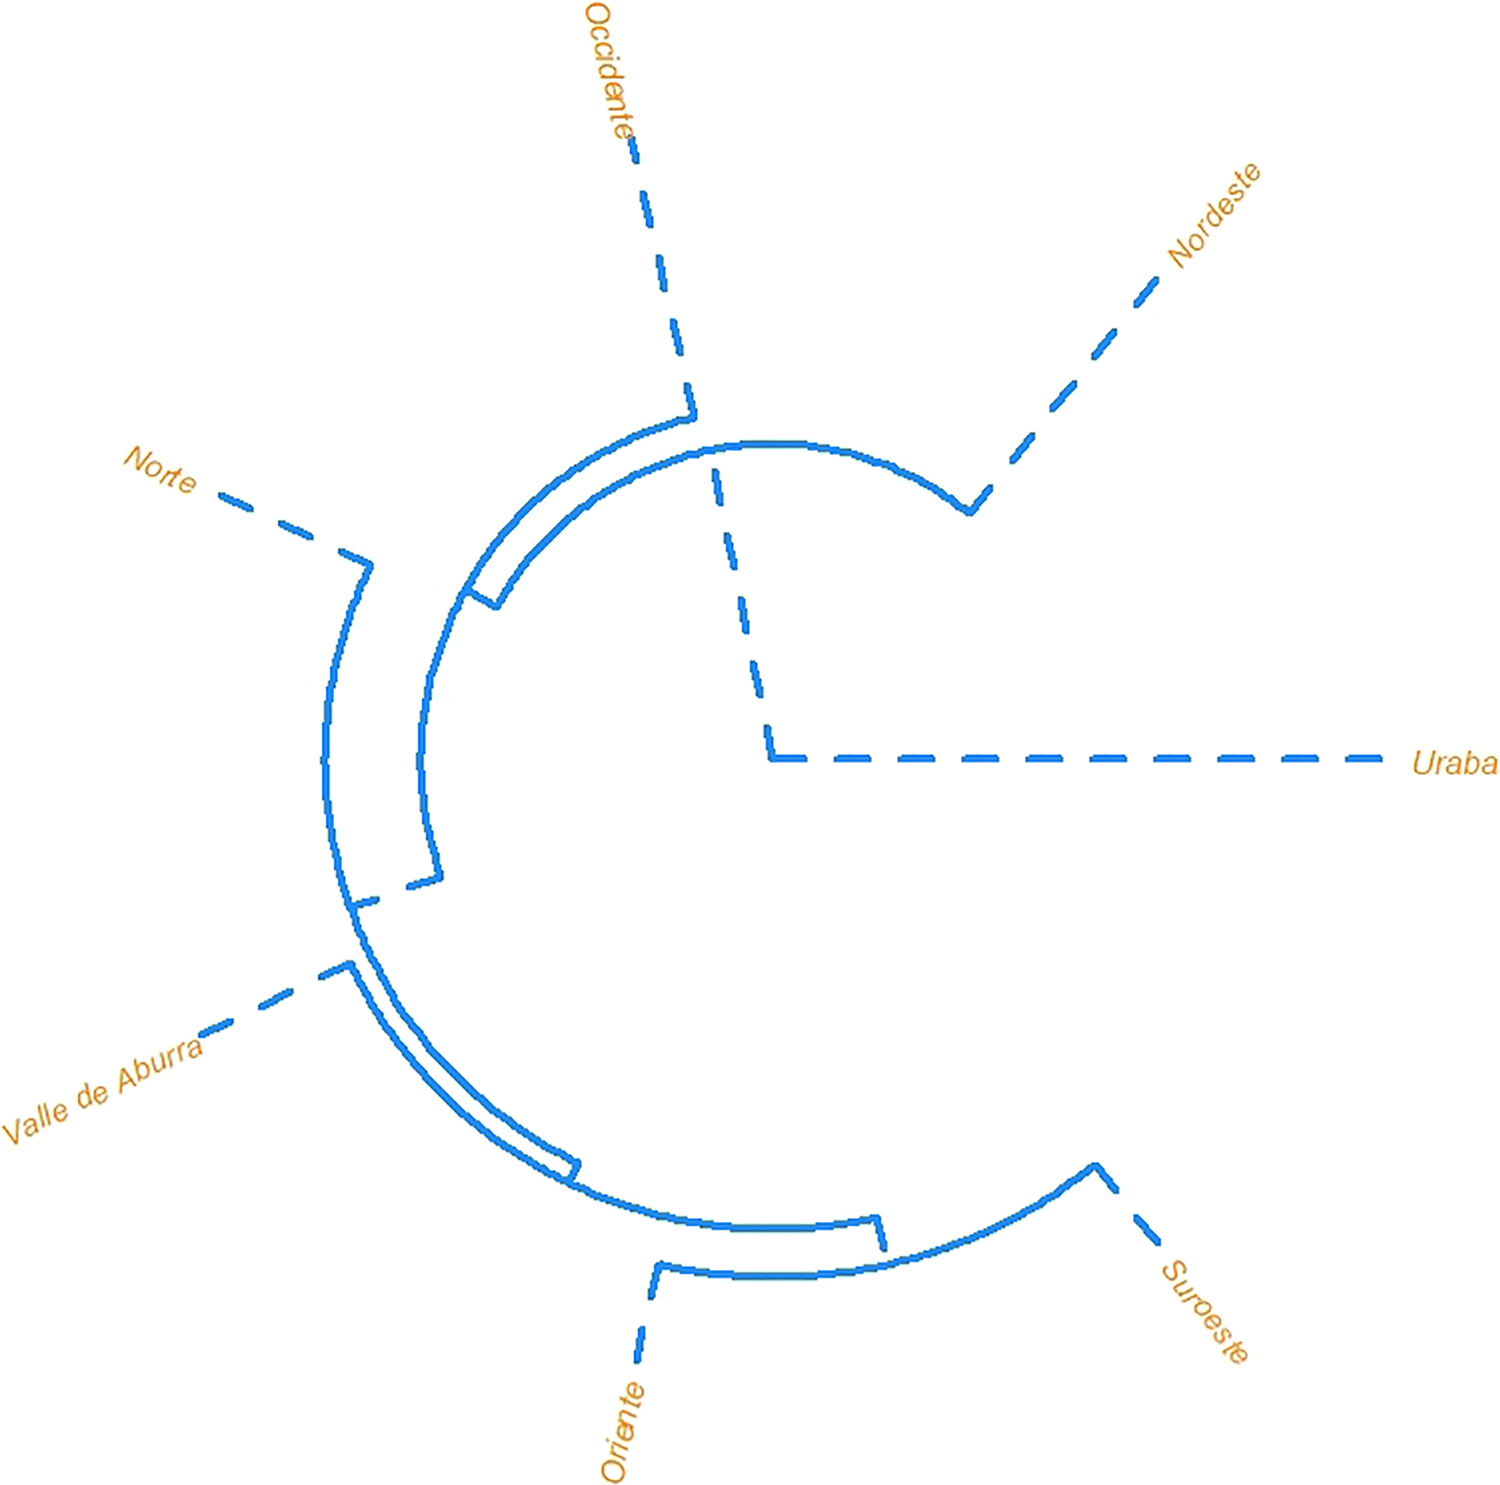
FIG. 4—Unrooted dendrograms projecting the Mahalanobis distances.
FIG. 5—Unrooted dendrograms projecting the Mahalanobis distances; see Table 2 for relationship between social group and birthplace.
The Mahalanobis distances among the refined sample are presented in Table 10. The D2 values for the Colombian group was closest to American Whites and Mexicans, followed by the Prehistoric Native Americans and Guatemalans, then the Mexican and Asian and American Black samples (Figure 8).
Discussion
Colombian Cranial Variation
To understand cranial variation and its relationship to social and geographical categories in Antioquia, several statistical models explored the interaction of cranial morphology to a priori group labels. The models did not perform well when birthplace or social group were used to ‘identify’ potential subsamples within the Antioquian sample. Heavy overlap of all groups in the LDFA suggest relative homogeneity across the groups in Antioquia. Interestingly, when plotting birthplace (see Figure 2), the ellipses for the Uraba and Nordeste cohorts exhibit the least amount of overlap compared to the other groups. This may indicate differences in cranial shape that make Uraba and Nordeste more unique, but the small sample size (n = 6) and the inclusion of outliers may play a role in these distributions. Socially defined category ‘B’ (Oriente and Suroeste) and ‘E’ (Valle de Aburra), are geographically proximate and exhibit heavy overlap in the LDFA plot and are likewise similarly positioned in the D2 plot (see Figure 5). Social groups ‘A’ (Uraba and Occidente) and ‘D’ (Norte) did not exhibit much overlap in the LDFA, despite geographical proximity; however, these two groups were more similar on the D2 plot (see Figure 5). Meaningful patterns did not emerge to relate craniometric variables to birthplace or social group categories. Additional study with a larger sample size could clarify or support our results.
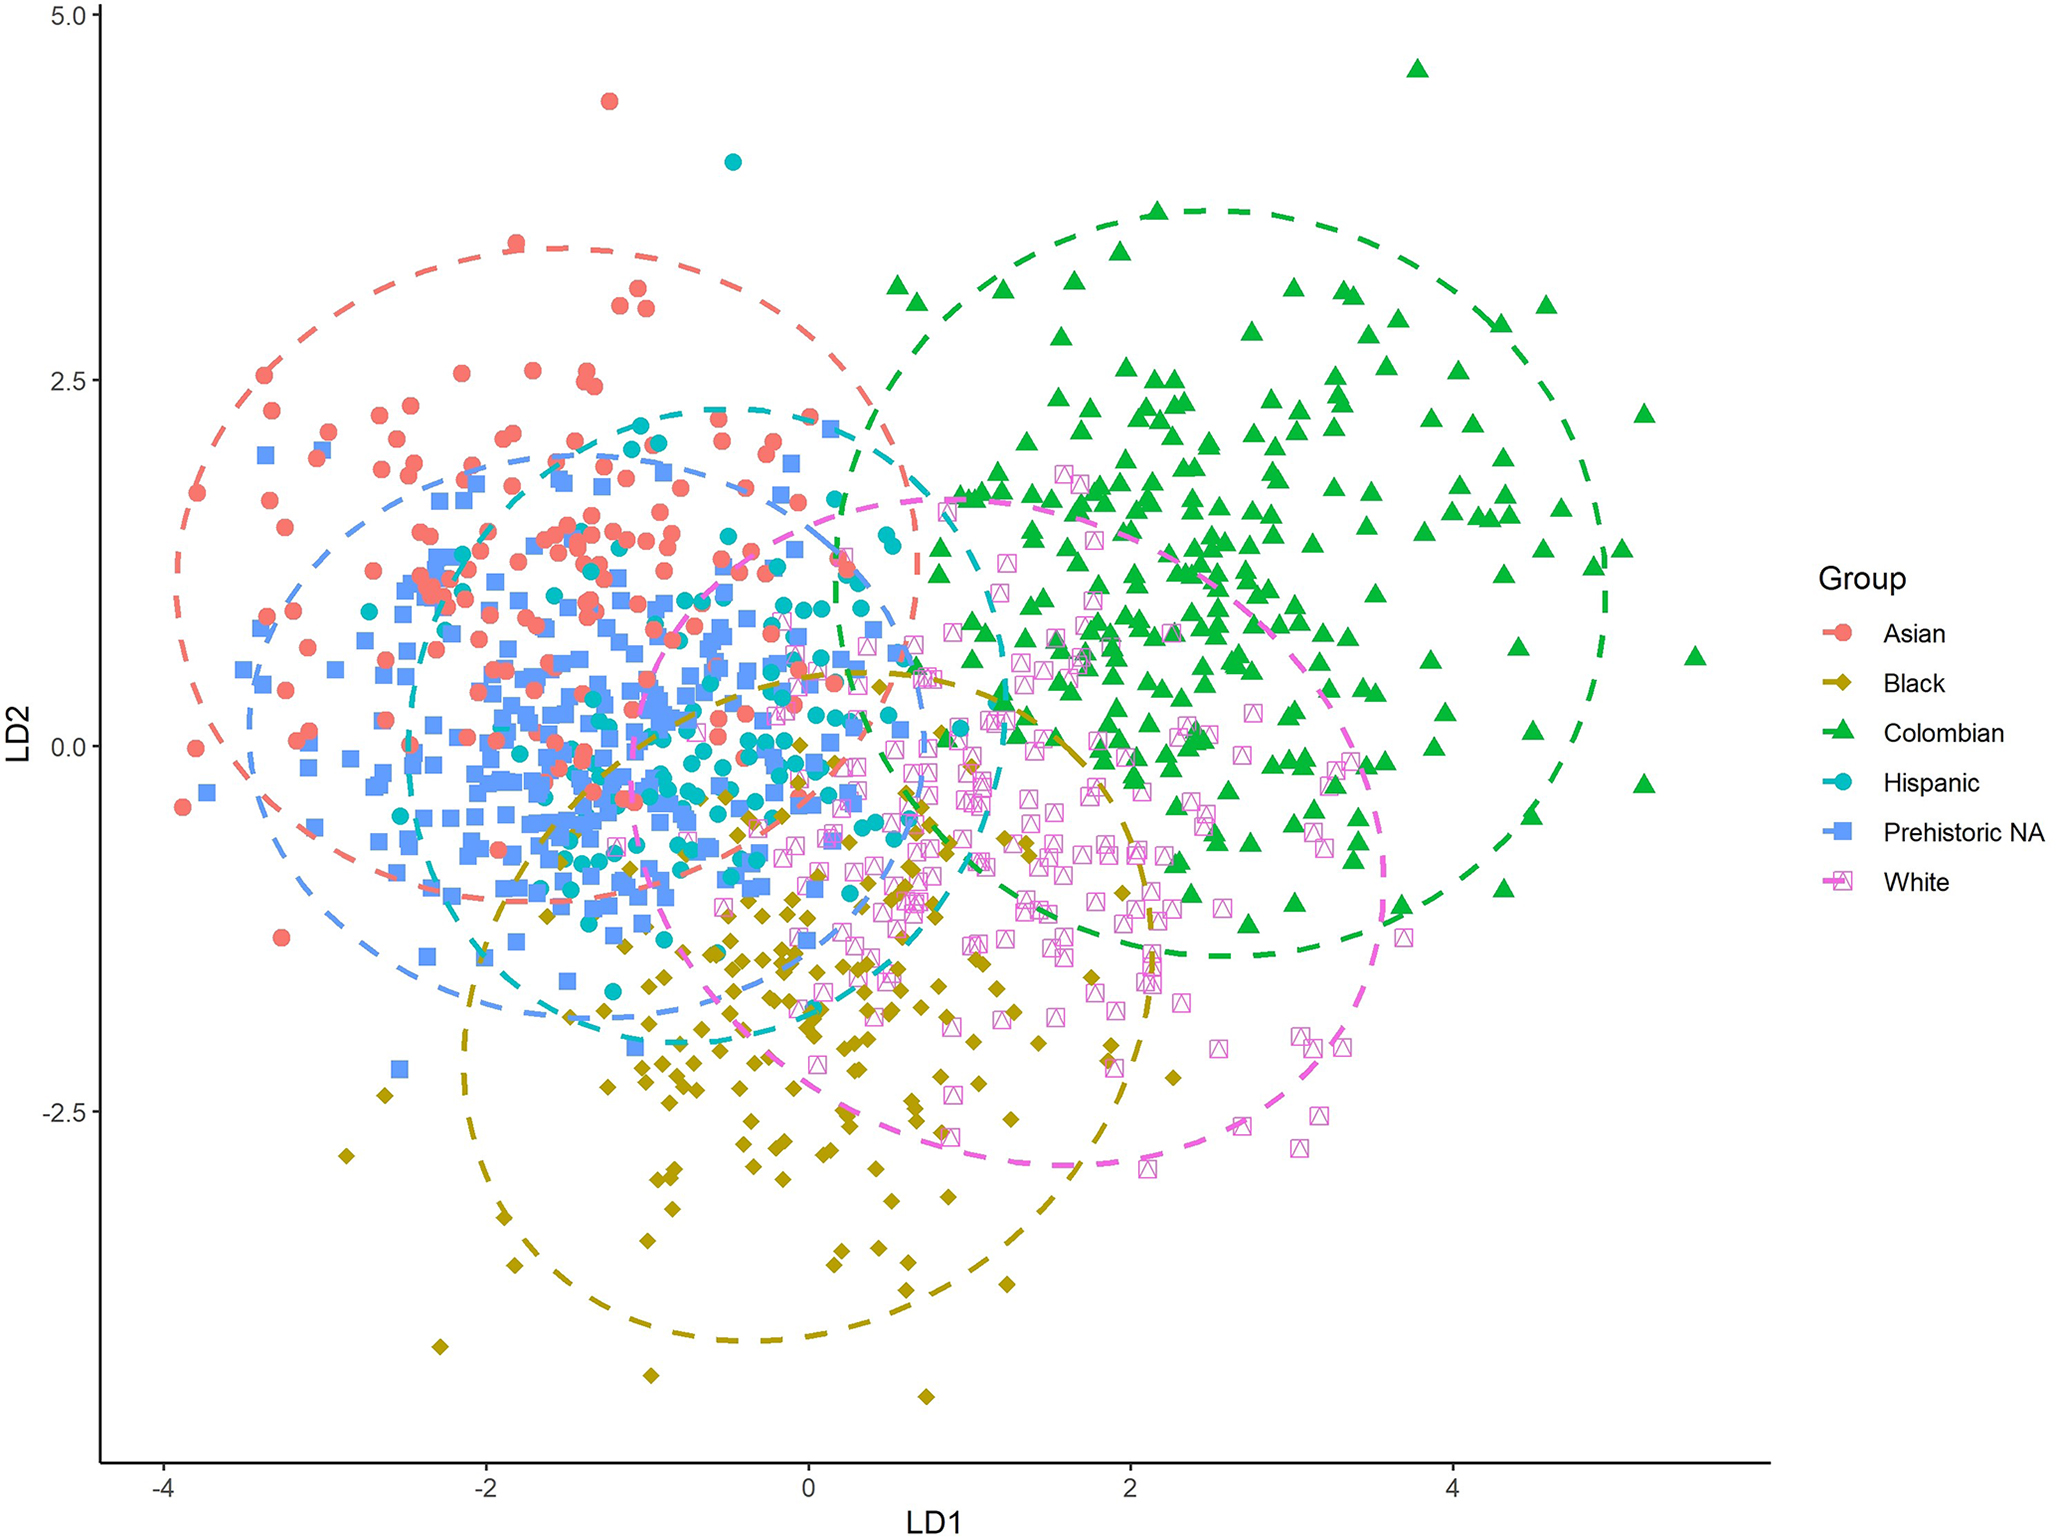
FIG. 6—The first two discriminant axes for the six-group analysis.
TABLE 8—Classification rate of Colombian and comparative groups (LOOCV).
|
American Black |
American White |
Asian |
Colombian |
Hispanic |
Prehistoric Native American |
CCR (%) |
||||||||
|
American Black |
142 |
14 |
3 |
6 |
22 |
10 |
72.1 |
|||||||
|
American White |
10 |
148 |
3 |
16 |
11 |
6 |
76.3 |
|||||||
|
Asian |
4 |
5 |
113 |
2 |
24 |
11 |
71.0 |
|||||||
|
Colombian |
7 |
19 |
2 |
205 |
8 |
2 |
84.4 |
|||||||
|
Hispanic |
9 |
9 |
11 |
2 |
45 |
14 |
50.0 |
|||||||
|
Prehistoric Native American |
15 |
9 |
31 |
1 |
20 |
251 |
76.7 |
|||||||
|
Overall: |
74.7% |
Classifying individuals by birthplace or a peer-perceived social category using cranial measurements does not work well in Antioquia. While this system can be used with some success in places like the U.S. and South Africa (Stull et al. 2014) where social race is used by the legal and law enforcement community as a ‘culturally constructed labeling system’ (Sauer 1992:109), it cannot be applied in Colombia, despite distinguishing individuals by social group or ethnicity (Monsalve & Hefner 2016). Using MMS data, Monsalve and Hefner (2016) found no significant differences in trait expression by birthplace, but more intraregional variation (46.0%) could be explained with MMS trait data compared to the craniometric data (26.0%) used in this study. Monsalve and Hefner (2016) identified three main clusters (Occidente-A, Suroeste-B, and Uraba-A; Valle de Aburra-E and Nordeste-C; and Oriente-B and Norte-D) based on mid-facial and vault characteristics. These clusters are not present within our results, indicating craniometric variation is not measurably different across groups or adequately captured by the ILDs used in this study. Further attempts to classify based on socially defined groups did not improve classifications with MMS data, which is similar to results reported here.
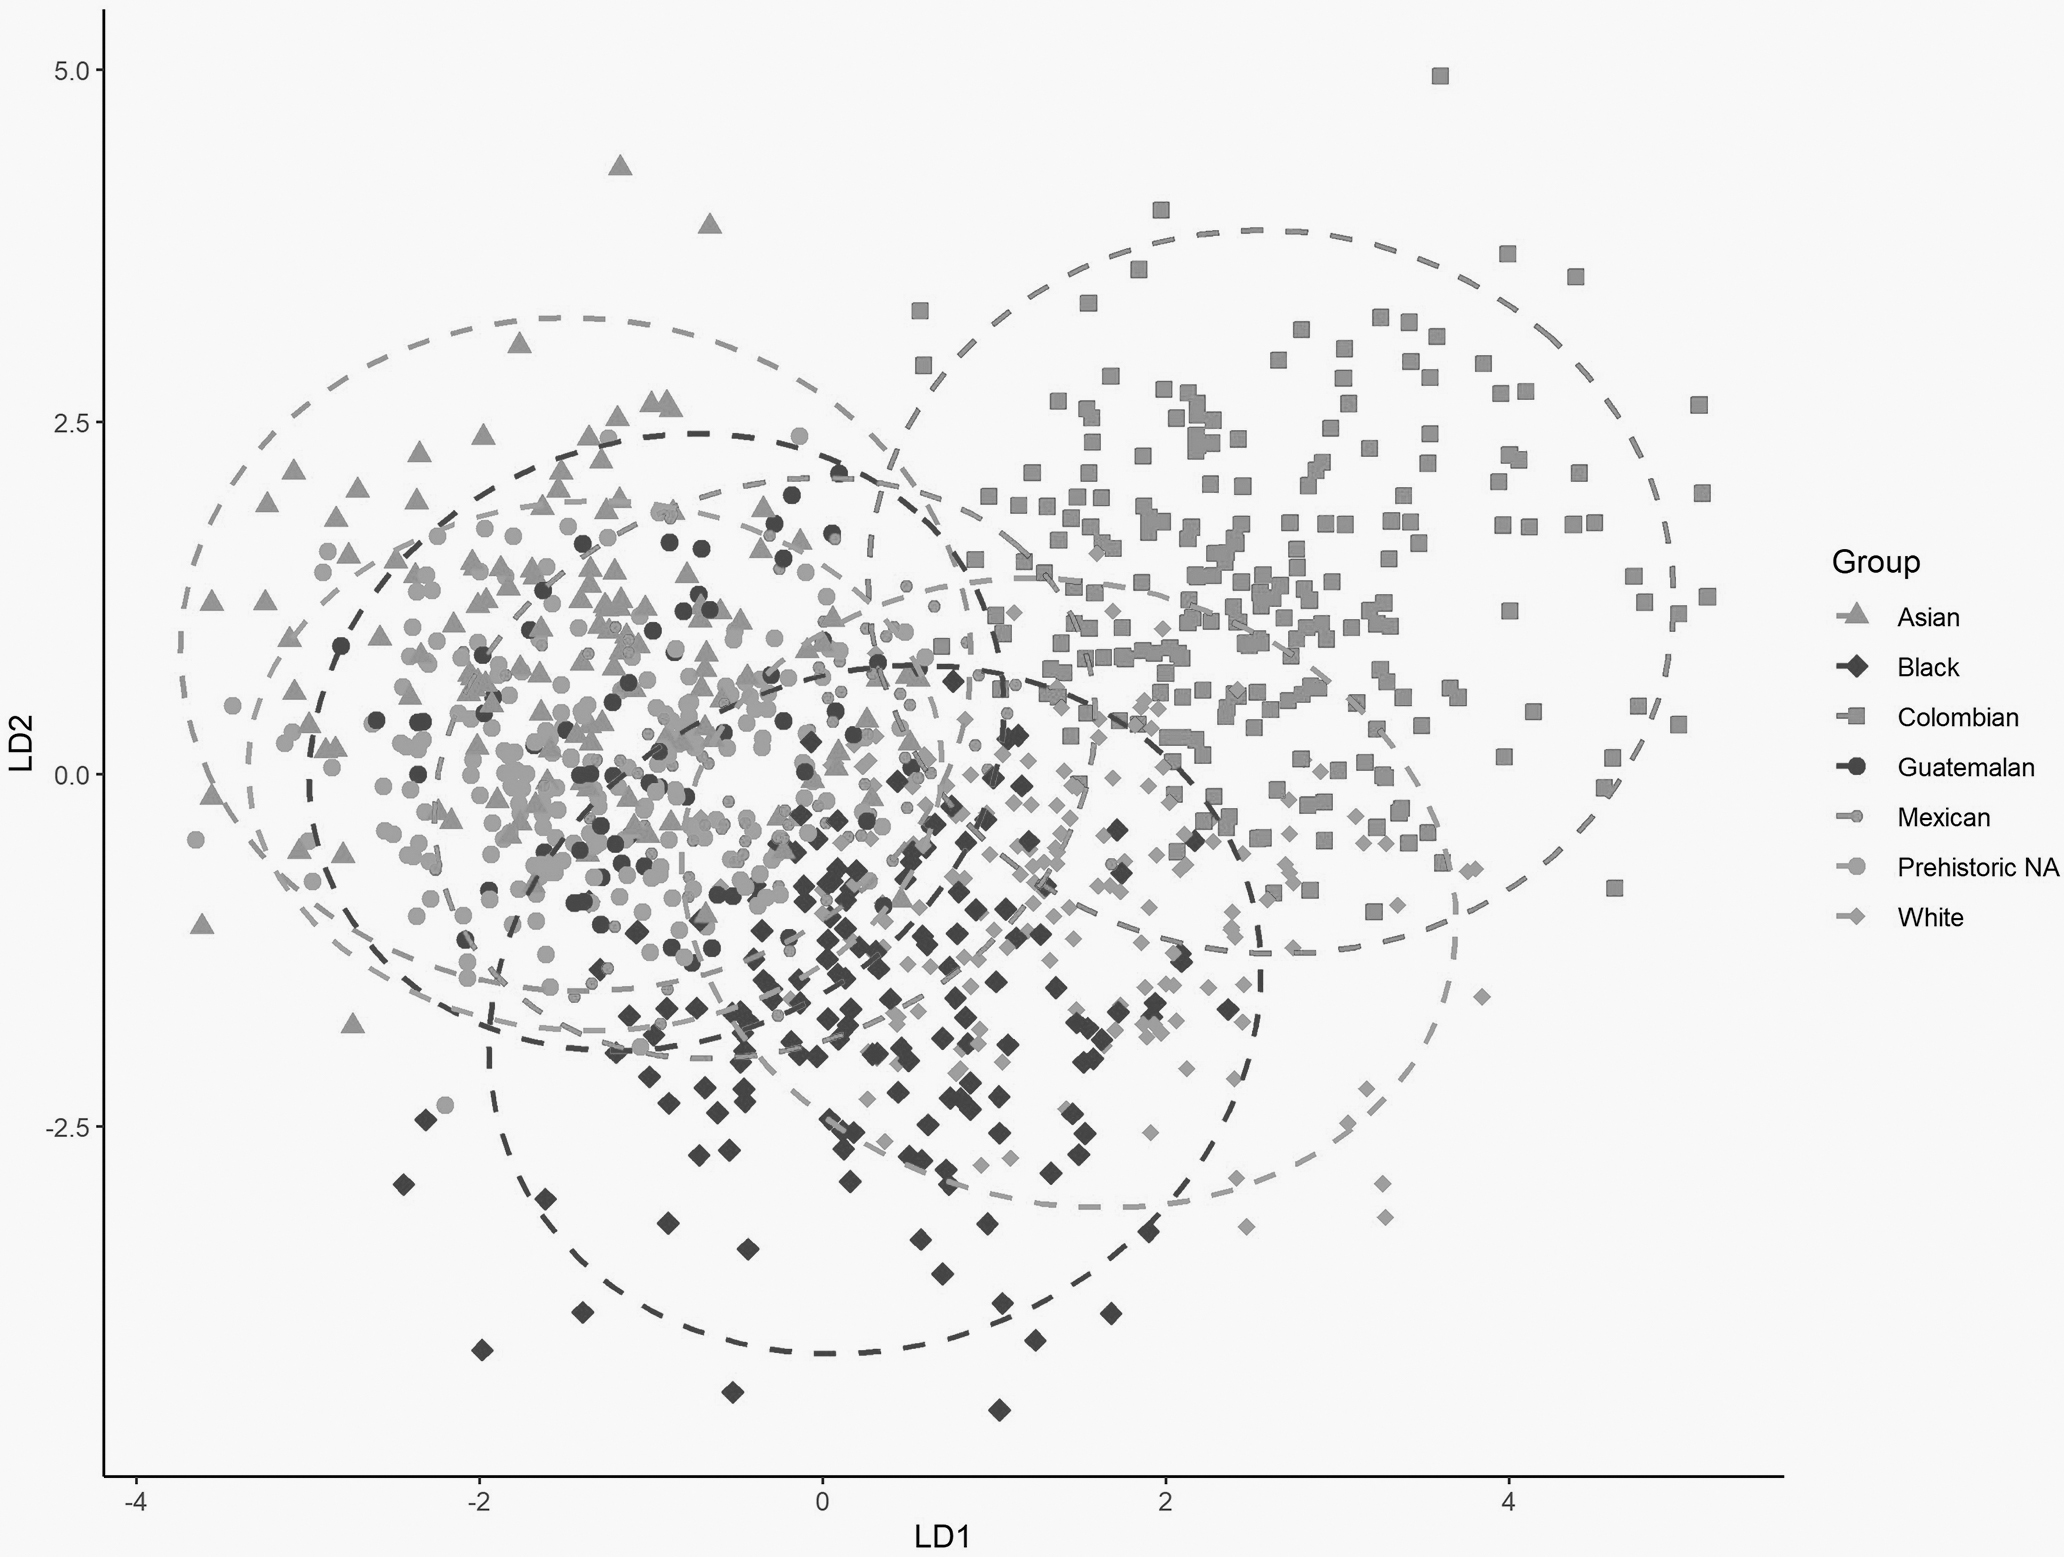
FIG. 7—The first two discriminant axes for the seven-group analysis.
TABLE 9—Classification rate of Colombian and comparative groups; refining the Hispanic group (LOOCV).
|
American Black |
American White |
Asian |
Colombian |
Guatemalan |
Mexican |
Prehistoric Native American |
CCR (%) |
|||||||||
|
American Black |
139 |
14 |
3 |
6 |
9 |
18 |
8 |
70.1 |
||||||||
|
American White |
10 |
145 |
3 |
16 |
4 |
9 |
6 |
75.1 |
||||||||
|
Asian |
3 |
5 |
110 |
1 |
10 |
20 |
10 |
69.2 |
||||||||
|
Colombian |
6 |
18 |
2 |
206 |
2 |
8 |
1 |
84.7 |
||||||||
|
Guatemalan |
0 |
1 |
1 |
0 |
5 |
3 |
3 |
38.5 |
||||||||
|
Mexican |
10 |
8 |
6 |
2 |
13 |
31 |
9 |
39.2 |
||||||||
|
Prehistoric Native American |
15 |
10 |
27 |
0 |
33 |
13 |
229 |
70.0 |
||||||||
|
Overall: |
71.4% |
TABLE 10—Mahalanobis distance (D2) matrix on the refined sample.
|
American Black |
American White |
Asian |
Colombian |
Guatemalan |
Mexican |
|||||||
|
American Black |
— |
|||||||||||
|
American White |
11.64 |
— |
||||||||||
|
Asian |
14.92 |
13.85 |
— |
|||||||||
|
Colombian |
15.85 |
13.56 |
15.34 |
— |
||||||||
|
Guatemalan |
16.34 |
17.17 |
13.60 |
15.12 |
— |
|||||||
|
Mexican |
11.65 |
11.78 |
7.82 |
13.86 |
10.62 |
— |
||||||
|
Prehistoric Native American |
13.26 |
15.27 |
12.41 |
14.80 |
10.65 |
9.52 |
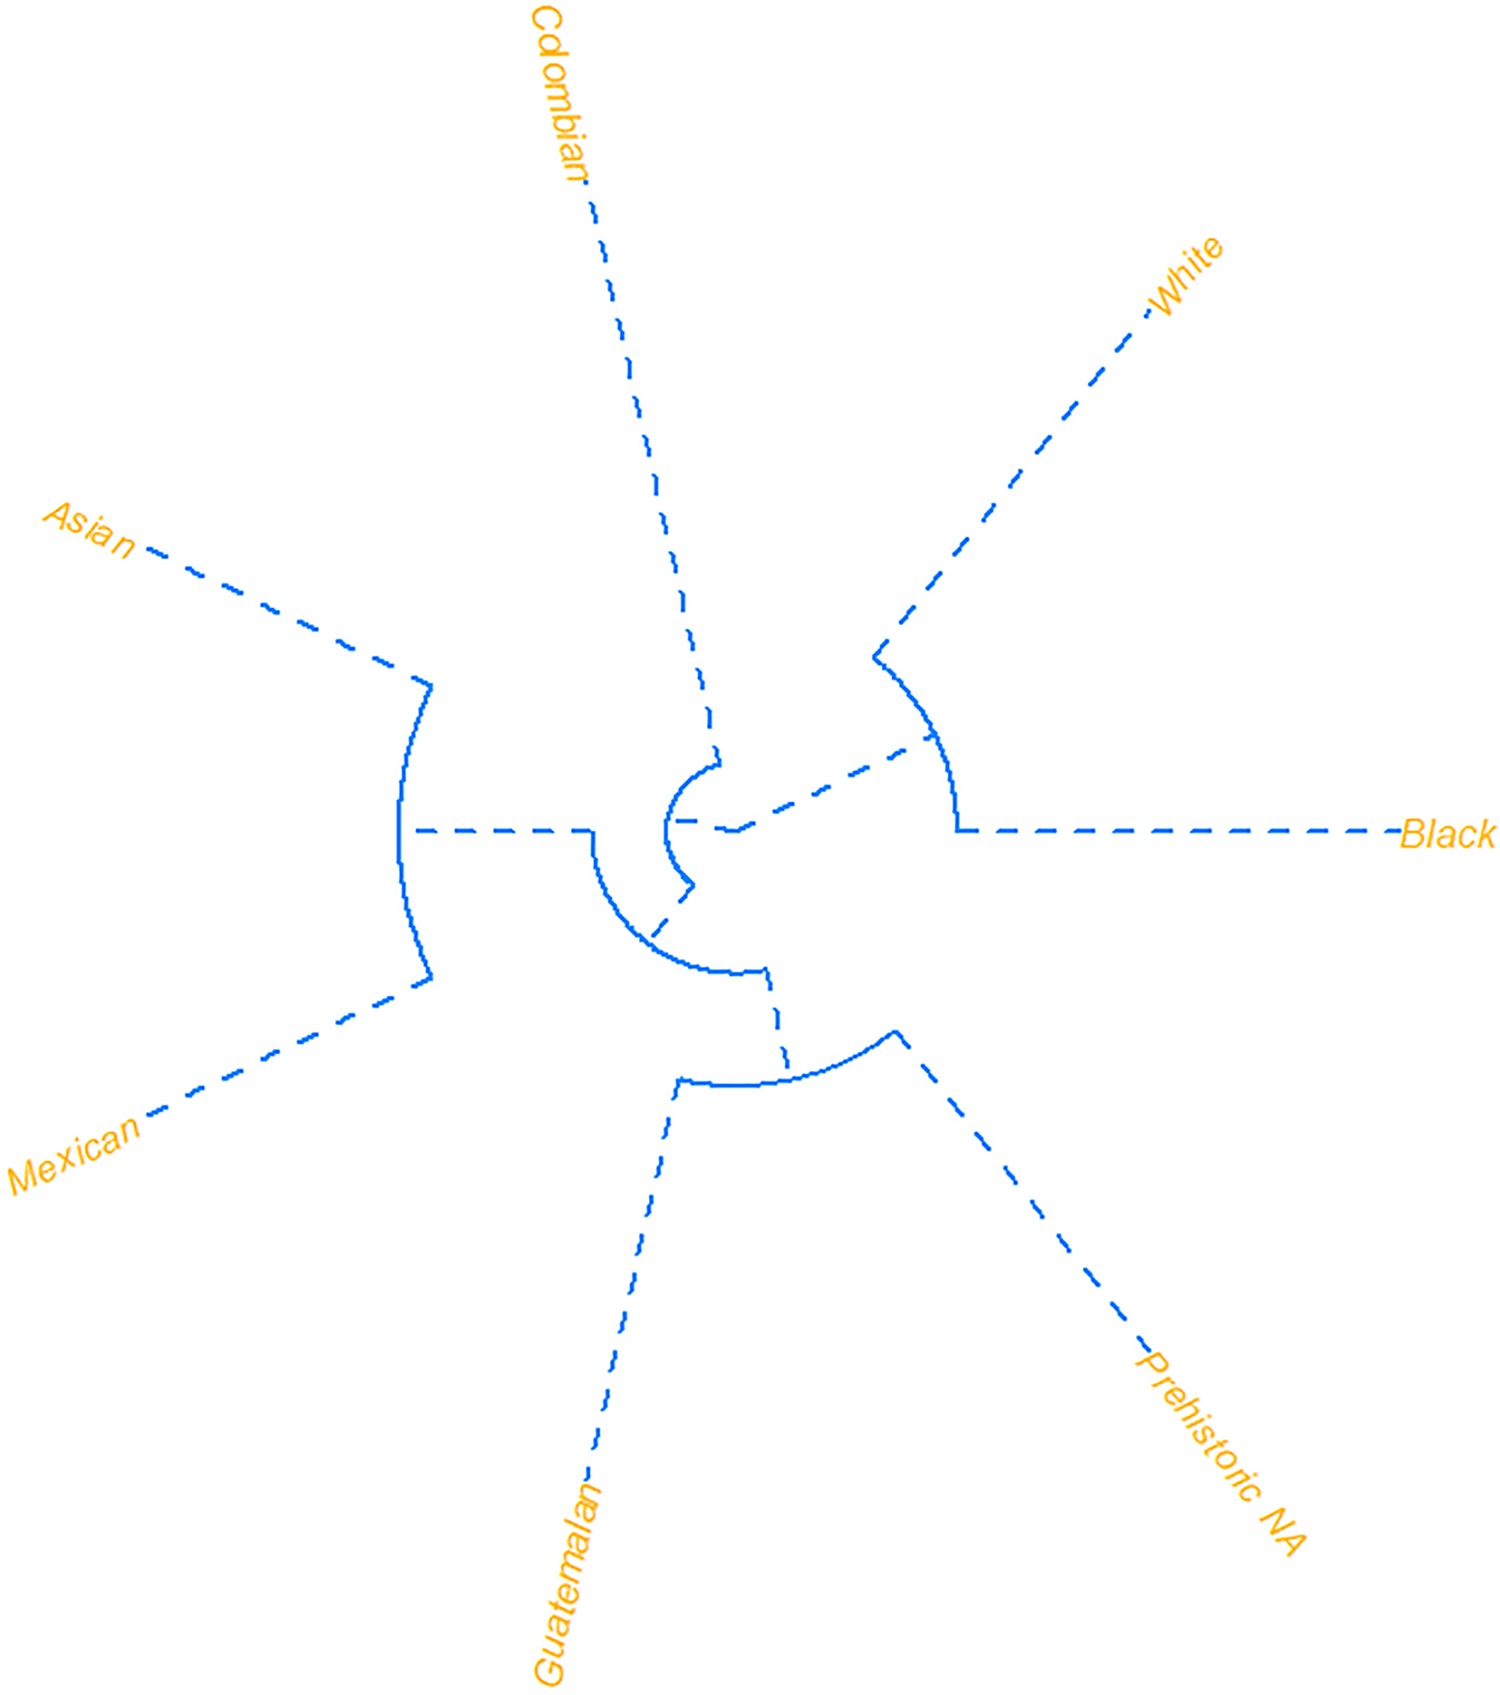
FIG. 8—Unrooted dendrograms projecting the Mahalanobis distances (Pre NA = Prehistoric Native American; Colom = Colombian; Black = American Black; White = American White; Guate = Guatemalan).
Craniometric analysis of the Colombian sample as a single dataset produced promising results. While other researchers noted heavy overlap with Hispanic craniometric data (namely Mexican and Guatemalan samples) (Dudzik & Jantz 2016; Hughes et al. 2019), the Colombian sample, e.g., “Hispanic”, did not overlap or misclassify considerably with these groups. This pattern was evident in the LDFA classification models, where Colombians most frequently misclassified as American Whites. Despite these results, classification accuracies were high for all groups except Mexican and Guatemalan samples. D2 scores for the Colombian sample were closest to the American White and Mexican samples, followed by the Prehistoric Native American, Guatemala, Asian, then American Black samples. Proximity to and misclassifications in the American White sample suggest a significant European ancestral component in Antioquia. Morphological and genetic research in Colombia suggests a diverse population structure corresponding to African, European, Mesoamerican, and South American origins (Bryc et al. 2010; Lopez et al. 2012). In Antioquia, geographical barriers, most notably the Andes mountain range, have contributed to population isolation and development of the paisa, a distinct regional identity based on socio-political processes and ancestral origins. The paisa includes a racial hierarchical component (Posada 2003), corresponding to ‘whiteness’ or ‘white’ ethnic groups (Álvarez 1996). Genetic studies in Antioquia demonstrate a significant European component, with smaller contributions from African and Native American groups (Bravo et al. 1996; Carvajal-Carmona et al. 2000; Sandoval et al. 1993). A significant genomic contribution from a male, Spanish founder population, persists in the Y-chromosome of individuals in the region today (Carvajal-Carmona et al. 2000). Interestingly, the majority of mitochondrial DNA contributions came from four Amerindian founder linages (Carvajal-Carmona et al. 2000).
Because craniometric data is highly heritable (Adhikari et al. 2016; Relethford & Harpending 1994; Roseman & Weaver 2004; Šešelj et al. 2015), and genetic structure in the Antioquian region indicates a large European contribution through migration (Bravo et al. 1996; Carvajal-Carmona et al. 2000), it is not surprising that the cranial phenotype is comparable to the American White sample of the groups tested. Both populations are genetically descended from European populations (Bryc et al. 2010, 2015), and therefore, are more similar to each other than other groups used in this analysis. Migration and restricted gene flow in Antioquia could explain the separation between the Colombian sample and the Asian-derived samples (Asian, Guatemalan, Mexican and prehistoric Native American). Genetic studies identify a mix of African, European, and Native American genetic contributions to populations in Antioquia (Bryc et al. 2010; Wang et al. 2008), which could explain these results.
Comparing our results to Monsalve and Hefner’s (2016) conclusions, we found that craniometric data has a higher classification accuracy (74.7%: pooled Hispanic data; and 71.4%: separate Hispanic groups) when compared with results derived with Artificial Neural Network analysis used on cranial MMS traits (48.0%). In their study, Colombians misclassified as American Black (10.0%), American White (16.6%), and Hispanic (10.0%) individuals (Monsalve & Hefner 2016). Our craniometric analysis shows less frequent misclassification for the same groups: American Black (2.5%), American White (7.4%), Asian (0.8%), prehistoric Native American (0.4%), and the two Hispanic groups: Mexican (3.2%) and Guatemalan (0.8%). Further comparison of the spatial distribution using the two approaches illustrates similar patterning. The PCA using cranial MMS data identified four clusters: 1) Hispanic and American White, 2) Pacific Islander and Asian, 3) American Black, and 4) Colombian. The D2 results from this metric-based study identified three clusters: 1) Asian and Mexican, 2) Guatemalan and prehistoric Native American 3) American Black, American White, and Colombian. Again, the separation of the Colombian sample from the Hispanic samples in both analyses bolsters calls for the refinement of this category in population affinity estimation. We recommend that Colombians from Antioquia not be included under the broad heading Hispanic, but as a separate sample in comparative analysis.
Implications for Future Work in the Region
There are several implications for future forensic work in the Americas and within Colombia. While we could not distinguish individuals by birthplace or social group using craniometric data, cranial variation is not necessarily homogeneous in Colombia. These results warrant additional testing of the Antioquian sample against other regions in the country. For example, mountainous and costal populations may differ from each other, which may be true for individuals born in cities like Barranquilla or Cartagena compared with Bogotá or Cali. Identification of larger, intraregional variation within Colombia may have direct implications for current migration events from Venezuela (Faiola 2018; Miami Herald 2018), potentially providing an option for estimating geographic origin in the region. Additionally, regional studies in Colombia may provide useful for identification efforts for unidentified individuals from Colombia’s armed conflict, which potentially number into the 100,000s (Fondebrider 2016). We hope our results stimulate this type of research in the region and other countries, especially those involved in mass migration events, as a possible avenue for estimating geographic origin.
All three Hispanic samples in this study (Mexico, Guatemala, and Colombia) are grouped under one classificatory group within traditional population affinity estimation models. However, the level of separation between the Colombian sample from the Mexican and Guatemalan samples warrants a rethinking of population affinity estimation for this group. Our results support previous findings by Spradley et al. (Figueroa-Soto & Spradley 2012; Spradley 2014b; Tise et al. 2014) and Ross et al. (Ross et al. 2014; Humphries et al. 2015) suggesting populations in Latin America, while geographically proximate, show considerable cranial variation. We suggest practitioners consider the origin of Hispanic samples and the use of pooled data in three- or five-group models. Hispanic samples, such as the subsample from the FDB, comprise individuals from neighboring countries like Costa Rica, Cuba, El Salvador, Guatemala, Mexico, Puerto Rico, and Panamá (Anderson 2008). Differences among these groups are certainly apparent at a finer level of refinement since each was subjected to a unique historical migration and evolutionary events.
While the debate over appropriate and necessary levels of population affinity refinement for forensic casework is ongoing, this research bolsters support toward a more refined approach. The addition of this regional sample to modern, reference datasets allows for population specific models for Colombians (Hefner & Spradley 2018; Spradley 2016). Future research using this and other diverse samples from Latin America is poised to address current issues in forensic anthropology research and practice.
Conclusion
This study aimed to assess if craniometric analysis can be used to identify intraregional variation within Antioquia, Medellín, Colombia. While we failed to demonstrate separation based on birthplace or social labels, the pooled Colombian sample separated well from other comparative groups, including other populations traditionally classified under the term Hispanic. This study demonstrates heterogeneity within Latin American populations, offering further support to the call for refinement of the Hispanic category.
Following the suggestions outlined in Hefner and Spradley (2018), we advocate a broad-level analysis, followed by further refinement, especially within the Hispanic group designation. As more data are collected on this diverse group and incorporated into reference databanks, researchers will identify patterned differences and nuances within those samples. Understanding and investigating these patterns could have profound implications for diasporic events in the Americas and contribute to identification in forensic casework in Latin America and the U.S.
In this study, the regional Antioquian sample was most useful when grouped together as a single Colombian dataset, and compared to other Hispanic and non-Hispanic groups encountered in forensic casework. This approach could be useful when incorporating reference data for new Hispanic populations. Further studies should incorporate cranial MMS and craniometric data together, as previous research demonstrates more accurate classification results when combined (Hefner et al. 2014).
References
Adhikari K, Fuentes-Guajardo M, Quinto-Sánchez M, Mendoza-Revilla J, Chacón-Duque JC, Acuña-Alonzo V, et al. A genome-wide association scan implicates DCHS2, RUNX2, GLI3, PAX1 and EDAR in human facial variation. Nature Communications 2016;7:11616.
Algee-Hewitt BFB. Population inference from contemporary American craniometrics. American Journal of Physical Anthropology 2016;160(4):604–624.
Algee-Hewitt BFB. Temporal trends in craniometric estimates of admixture for a modern American sample. American Journal of Physical Anthropology 2017;163(4):729–740.
Álvarez V. Poblamiento y población en el valle de Aburrá y Medellín, 1541–1951. In: Melo JO, ed. Historia de Medellín. Medellín: Suramericana;1996:57–84.
Anderson BE. Identifying the dead: Methods utilized by the Pima County (Arizona) Office of the Medical Examiner for undocumented border crossers, 2001–2006. Journal of Forensic Sciences 2008;53(1):8–15.
Bravo ML, Valenzuela CY, Arcos-Burgos OM. Polymorphisms and phyletic relationships of the Paisa community from Antioquia (Colombia). Gene Geography: A Computerized Bulletin on Human Gene Frequencies 1996;10(1):11–17.
Bryc K, Durand EY, Macpherson M, Reich D, Mountain JL. The genetic ancestry of African Americans, Latinos, and European Americans across the United States. The American Journal of Human Genetics 2015;96:37–53.
Bryc K, Velez C, Karafet T, Moreno-Estrada A, Reynolds A, Auton A, Hammer M, Bustamante CD, Ostrer H. Genome-wide patterns of population structure and admixture among Hispanic/Latino populations. PNAS 2010;107(Supplement 2):8954–8961.
Carvajal D. As Colombia emerges from decades of war, migration challenges mount. Migration Policy Institute. 2017. https://www.migrationpolicy.org/article/colombia-emerges-decades-war-migration-challenges-mount. Accessed January 8, 2020.
Carvajal-Carmona LG, Soto ID, Pineda N, Ortíz-Barrientos D, Duque C, Ospina-Duque J, et al. Strong Amerind/White sex bias and possible Sephardic contribution among the founders of a population in Northwest Colombia. American Journal of Human Genetics 2000;67:1287–1295.
Dudzik B, Jantz RL. Misclassifications of Hispanics using Fordisc 3.1: Comparing cranial morphology in Asian and Hispanic populations. Journal of Forensic Sciences 2016;61(5):1311–1318.
Dunn RR, Spiros MC, Kamnikar KR, Plemons AM, Hefner JT. Ancestry estimation in forensic anthropology: A review. WIREs Forensic Science; 2020. doi: https://onlinelibrary.wiley.com/doi/10.1002/wfs2.1369.
Faiola A. From riches to rags: Venezuelans become Latin America’s new underclass. Washington Post. July 27, 2018. https://www.washingtonpost.com/news/world/wp/2018/07/27/feature/as-venezuela-crumbles-its-fleeing-citizens-are-becoming-latin-americas-new-underclass/?noredirect=on&utm_term=.103b2782766f.
Figueroa-Soto C, Spradley MK. Cranial variation among three regional groups in Mexico. In: Proceedings of the 82nd Annual Meeting of the American Association of Physical Anthropologists, April 9–13, 2013; Knoxville, TN.
Fondebrider L. The application of forensic anthropology to the investigation of cases of political violence: Perspectives from South America. In: Blau S, Ubelaker DH, eds. Handbook of Forensic Anthropology and Archaeology. 2nd ed. New York: Routledge; 2016:65–74.
Hefner JT. The macromorphoscopic databank. American Journal of Physical Anthropology 2018;166(4):994-1004.
Hefner JT, Pilloud MA, Buikstra JE, Vogelsberg CCM. A brief history of biological distance analysis. In: Pilloud MA, Hefner JT, eds. Biological Distance Analysis: Forensic and Bioarchaeological Perspectives. New York: Elsevier; 2016:3–22.
Hefner JT, Spradley MK. Ancestry (forensic applications). In: Trevathan W, ed. The International Encyclopedia of Biological Anthropology. Hoboken, NJ: John Wiley & Sons, Inc.; 2018:1–3.
Hefner JT, Spradley MK, Anderson BE. Ancestry assessment using random forest modeling. Journal of Forensic Sciences 2014;59(3):583–589.
Howells WW. Cranial Variation in Man: A Study by Multivariate Analysis of Patterns of Differences among Recent Human Populations. Cambridge, MA: The Museum; 1973.
Hughes CE, Dudzik B, Algee-Hewitt BFB, Jones A, Anderson BE. Undertanding (mis)classification trends of Latin Americans in Fordisc 3.1: Incorporating cranial morphology, microgeographic origin, and admixture proportions for interpretation. Journal of Forensic Sciences 2019;64(2):353–366.
Humphries AL, Maxwell AB, Ross AH, Ubelaker DH. A geometric morphometric study of regional craniofacial variation in Mexico. International Journal of Osteoarchaeology 2015;25(6):795–804.
Jantz RL, Moore-Jansen PH. A database for forensic anthropology: Structure, content, and analysis. Knoxville: Department of Anthropology, University of Tennessee; 1988.
Jantz RL, Ousley SD. Fordisc 3.0: Personal computer forensic discriminant functions. Knoxville: University of Tennessee; 2005.
Langley NR, Meadows Jantz L, Ousley SD, Jantz RL. Data collection procedures for forensic skeletal material 2.0. Knoxville: University of Tennessee; 2016
López, G. Hispanics of Colombian Origin in the United States, 2013. Pew Research Center. September 15, 2015. https://www.pewresearch.org/hispanic/2015/09/15/hispanics-of-colombian-origin-in-the-united-states-2013/. Accessed January 8, 2020.
Lopez MA, Casallas DA, Castellanos D, Soto FV, Bethard JD. Unveiling ancestry in Colombia through morphometric analysis. In: Proceedings of the 64th Annual Meeting of the American Academy of Forensic Sciences, February 20–25, 2012; Atlanta, GA.
McFerrin L. Statistical analysis tools for high dimension molecular data (HDMD). Created 2013. https://www.rdocumentation.org/packages/HDMD/versions/1.2. Accessed January 14, 2020.
Monsalve T. Hefner JT. Macromorphoscopic trait expression in a cranial sample from Medellín, Colombia. Forensic Science International 2016;266:574.e1–574.e8.
Posada C. La raza negra en Colombia: Antioqueños y chocoanos. Estudios de Literatura Colombiana 2003;12.
R Core Team. R: A language and environment for statistical computing. R Foundation for Statistical Computing, Vienna, Austria, 2018. http:www.R-project.org/. Accessed October 14, 2018.
Relethford JH. Craniometric variation among modern human populations. American Journal of Physical Anthropology 1994;95(1):53–62.
Relethford JH. Population-specific deviations of global human craniometrics variation from a neutral model. American Journal of Physical Anthropology 2010;142(1):105–111.
Relethford JH, Harpending HC. Craniometric variation, genetic theory, and modern human origins. American Journal of Physical Anthropology 1994;95(3):249–270.
Roseman CC, Weaver TD. Multivariate apportionment of global human craniumetric diversity. American Journal of Physical Anthropology 2004;125(3):257–263.
Ross AH, Slice DE, Ubelaker DH. Population affinities of Hispanic crania. In: Berg GD, Ta’ala SC, eds. Biological Affinity in Forensic Identification of Human Skeletal Remains: Beyond Black and White. Boca Raton, FL: CRC Press; 2014:155–164.
Ross AH, Slice D, Ubelaker DH, Falsetti AB. Population affinities of 19th century Cuban crania: Implications for identification criteria in South Florida Cuban Americans. Journal of Forensic Sciences 2004;49:11–16.
Sandoval C, de la Hoz A, Yunis E. Estructura genética de la población Colombiana. Revista de la Facultad de Medicina–Universidad Nacional de Colombia 1993;41(1):3–14.
Sauer NJ. Forensic anthropology and the concept of race: If races don’t exist, why are forensic anthropologists so good at identifying them? Journal of Social Science and Medicine 1992;34:107–111.
Šešelj M, Duren DL, Sherwood RJ. Heritability of the human craniofacial complex. The Anatomical Record 2015;298:1535–1547.
Spradley MK. Metric ancestry estimation from the postcranial skeleton. In: Berg GE, Ta’ala SC, eds. Biological Affinity in Forensic Identification of Human Skeletal Remains: Beyond Black and White. Boca Raton, FL: CRC Press; 2014a:83–94.
Spradley MK. Metric methods for the biological profile in forensic anthropoology: Sex, ancestry, and stature. Academic Forensic Pathology 2016;6(3):391–399.
Spradley MK. Toward estimating geographic origin of migrant remains along the United States–Mexico border. Annals of Anthropological Practice 2014b;38:101–110.
Stull KE, Kenyhercz MW, L’Abbe EN. Ancestry estimation in South Africa using craniometrics and geometric morphometrics. Forensic Science International 2014;245:206-e1.
Tise ME, Kimmerle EH, Spradley MK. Craniometric variation of diverse populations in Florida: Identification challenges within a border state. Annals of Anthropological Practice 2014;38:111–123.
van Buuren S, Groothuis-Oudshoorn K. Multiple imputation by chained equations (MICE) v.2.5; 2011.
Wang S, Ray N, Rojas W, Parra MV, Bedoya G, Gallo C, et al. Geographic patterns of genome admixture in Latin American mestizos. PLoS Genetics 2008;4(3):e1000037.
Wrobel G, Hair A, Biggs J. Introducing the Maya Crania Photogrammetry Initiative. In: Proceedings from the 16th Annual Meeting of the Belize Archaeology Symposium, June 2018; San Ignacio, Belize.
aDepartment of Anthropology, Michigan State University, East Lansing, MI 48824, USA
bDepartamento de Antropología—FCSH, Universidad de Antioquia, Medellín, Colombia
*Correspondence to: Kelly R. Kamnikar, Department of Anthropology, 655 Auditorium Drive, Michigan State University, East Lansing, MI 48824, USA
e-mail: kamnikar@msu.edu
Received 17 July 2019; Revised 29 April 2020; Accepted 02 May 2020